Figure 3. Retinal precursors were
identified in the pars plana of adult rd1 mice. Double-headed
arrows indicate the pars plana. A: At P30, many cells positive
for rhodopsin as well as recoverin were seen in the pars plana of rd1
mice (n=39). B: The majority of the recoverin-positive cells
were stained with PNA (n=12). C: The proportions of
recoverin-positive cells in the pars plana at P30 that are positive for
PNA or rhodopsin (mean±SEM) are presented. After the number of
recoverin-positive cells within 320 µm width of the pars plan were
determined from a single optical scan (10.0 μm thick), the number of
those also positive for rhodopsin and PNA were determined from the same
image. Three independent images randomly obtained from the same eye
were analyzed to calculate the proportion of recoverin-positive cells
that were also positive for rhodopsin (Rho) or PNA (PNA) or neither
(Rcv) per animal. Average proportion (%) of cells for each category was
determined from 6 animals. D: Many retinal precursors bridged
both the retina and pars plana. Note that the cilioretinal border was
sharply demarcated with DAPI staining (n=24). E:
Recoverin-positive cells (arrowhead) in the pars plana at P120. Note
that a gap between the pars plana and retina (open arrowhead) was seen
with DAPI staining. F: Increased numbers of recoverin-positive
cells were observed in the pars plana of P60 (31.2 fold; n=8) and P120
(7.6 fold; n=6) rd1 mice compared with P60 wild-type mice
(n=6). The number of recoverin-positive cells within 320 µm width of
the pars plan from a single optical scan (10.0 μm thick) were
determined from three independent images randomly obtained from the
same eye. Average number of recoverin-positive cells within 320 µm
width of the pars plan (mean±SEM) were determined for each group (i.e.,
P60 wild-type mice, P60 rd1 mice, and P120 rd1 mice). Note that the
number of recoverin-positive cells decreased with aging, from P60 to
P120, in rd1 mice. G: A representative image of a
single thick scan used for quantification of recoverin-positive (green)
cells in the pars plana (filled arrowhead) is shown. A semitransparent
white line outlines the cilioretinal border. Those that encompassed the
border (open arrowhead) were excluded. Note that the immunopositive
cells in the deep retina are defocused, while those in the ciliary
epithelium of the pars plana appear sharper. The oval structures
connected to a cell body through a thin process (filled arrow) were
considered cone pedicles, thus excluded from the cell count. H, I,
J: Recoverin-positive cells in the pars plana with
synaptophysin-positive synaptic vesicles are presented (J; n=4;
arrowhead). A merged image of H and I is shown. Scale
bar equals 25 μm in D, E, G, and H and 50 μm in A
and B. A, B, D, H, I, and J are thick scans
(merged from 2 scans; each scan was 7.1 μm thick for A and B
and 3.9 μm thick for D, G, H, and I, respectively). E
is presented as a thin scan (a single scan 10.0 μm thick).
Abbreviations: rhodopsin (Rho); recoverin (Rcv); ciliary body (CB);
synaptophysin (Syn).
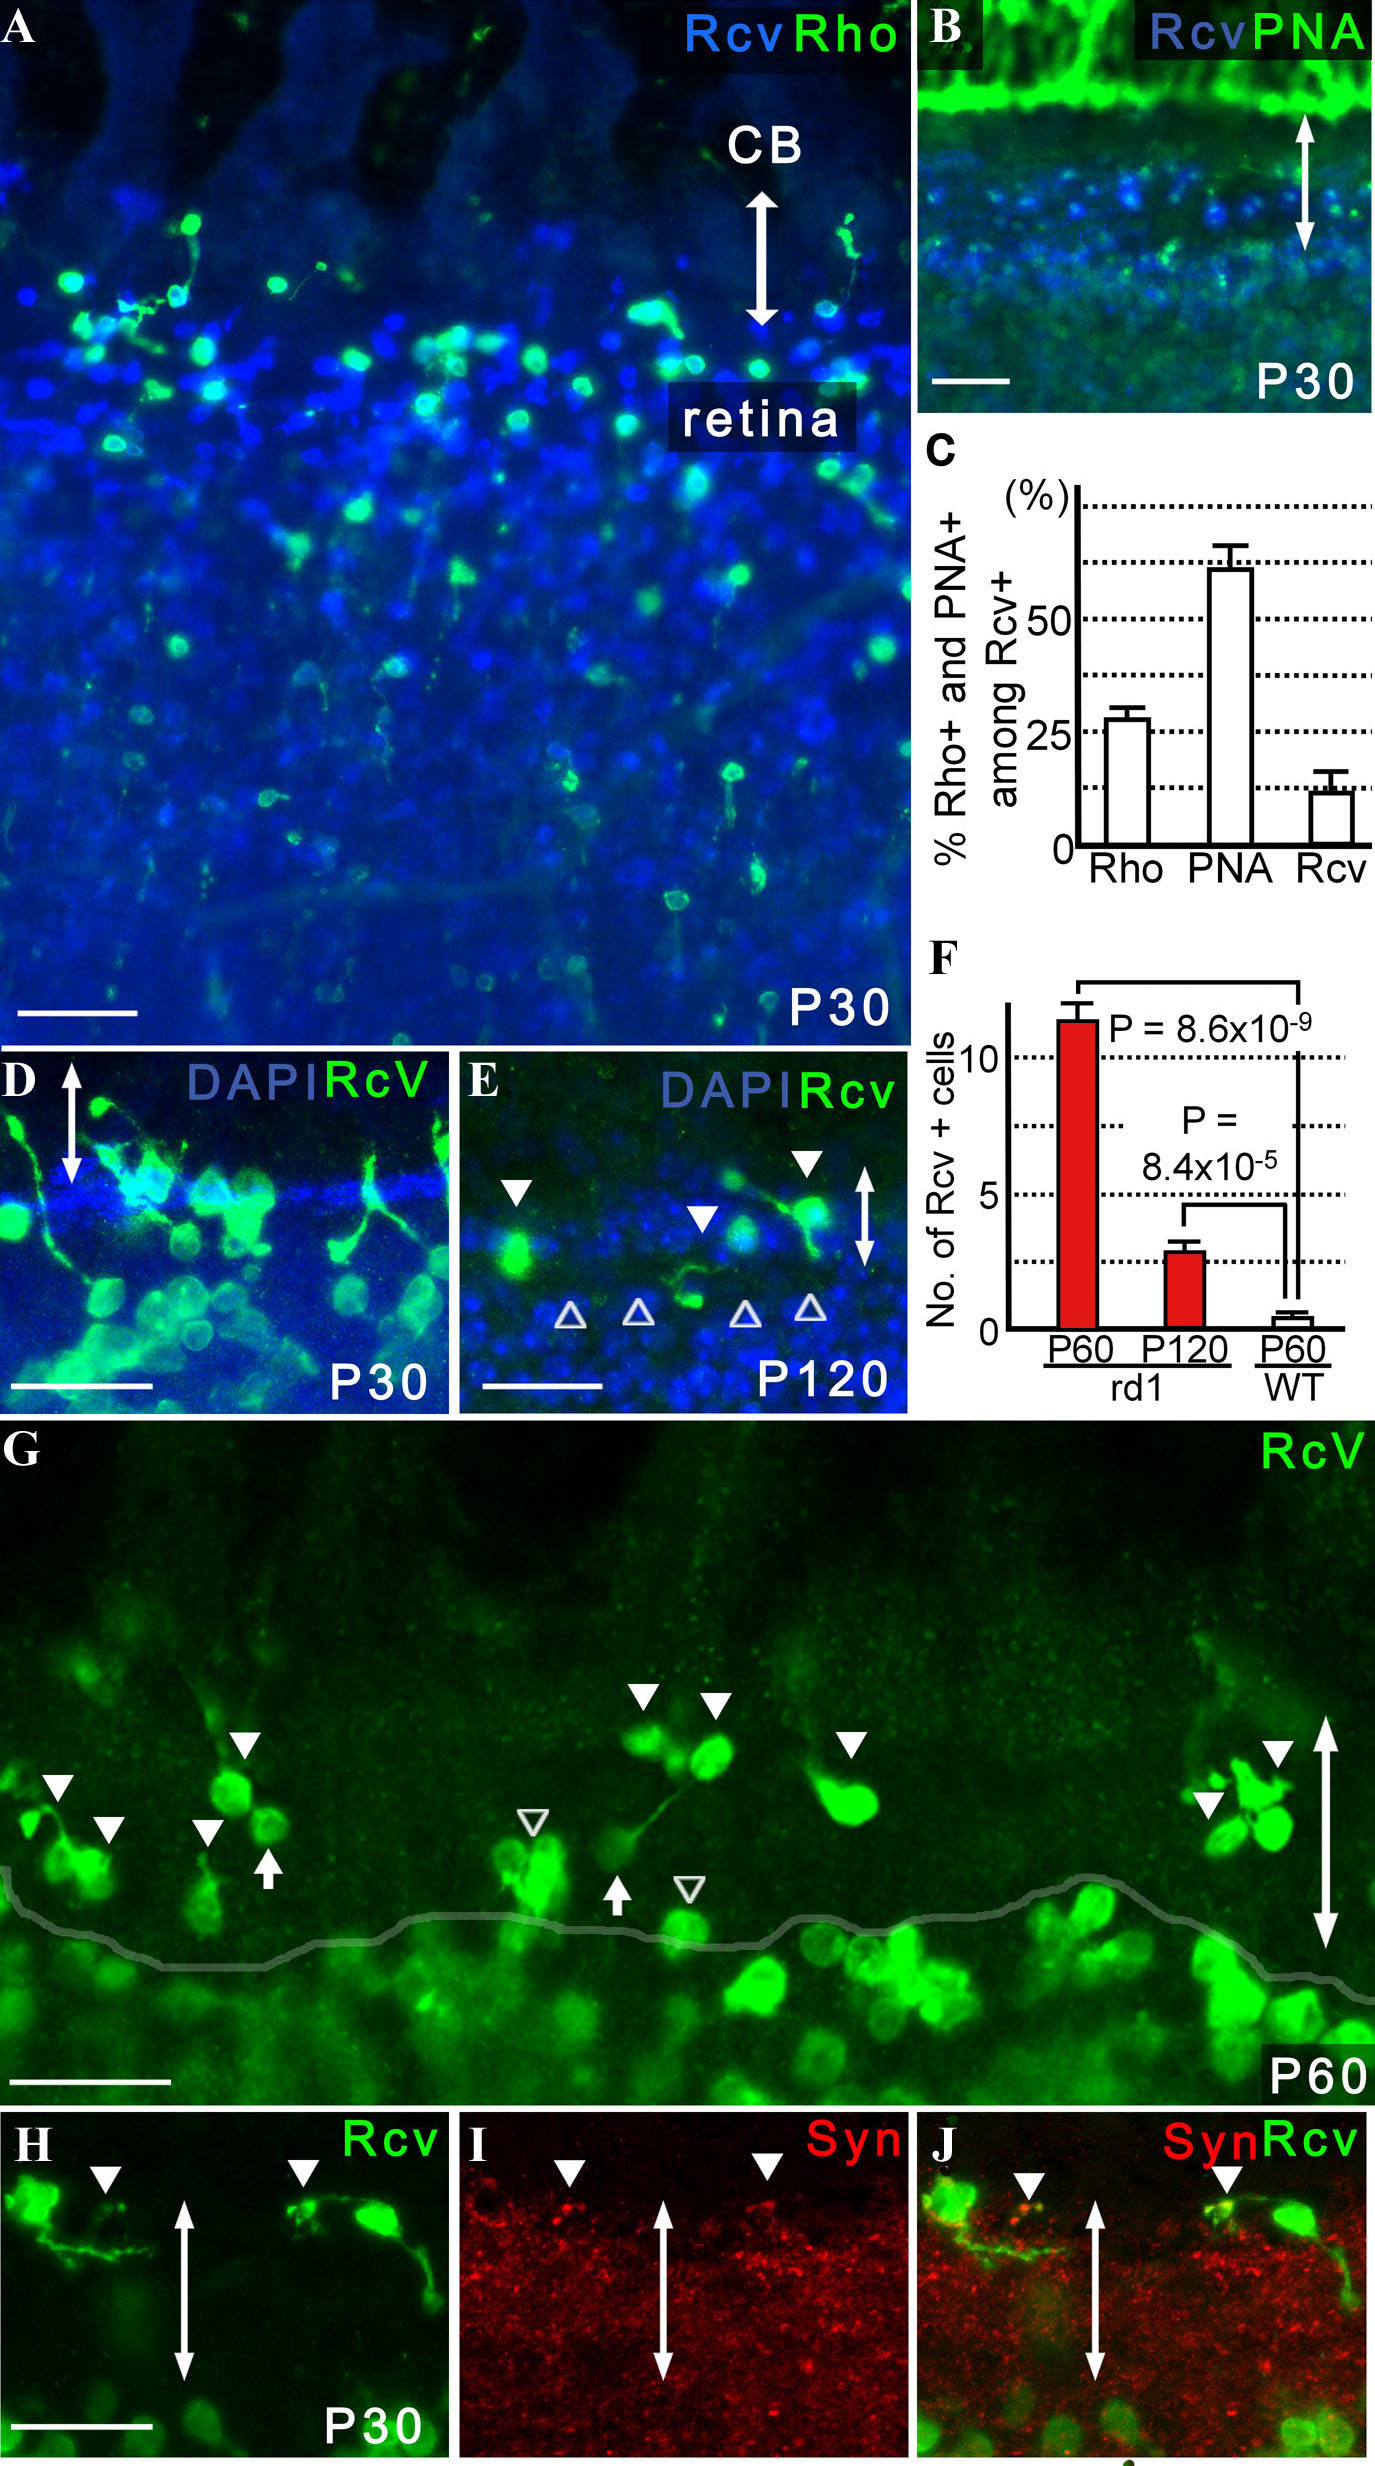
 Figure 3 of Nishiguchi, Mol Vis 2009; 15:187-199.