Figure 2. CREB phosphorylation is increased by hydrostatic pressure in ONH astrocytes. A: This panel contains a representative western blot of p-CREB (Ser-133) phosphorylation induced by elevated pressure in AA
astrocytes over a 6 h period. B: Shown is a respresentative western blot of p-CREB phosphorylation induced by elevated pressure in CA astrocytes over a 6
h period. The bar graphs compare the data normalized to the total CREB protein in the extract. The basal levels of CREB are
lower in AA astrocytes compared to CA astrocytes (p<0.05; asterisk, n=3). The fold-change of p-CREB in the AA astrocytes is
higher than in the CA astrocytes (p<0.05; asterisk, n=3). Error bars indicate SEM.
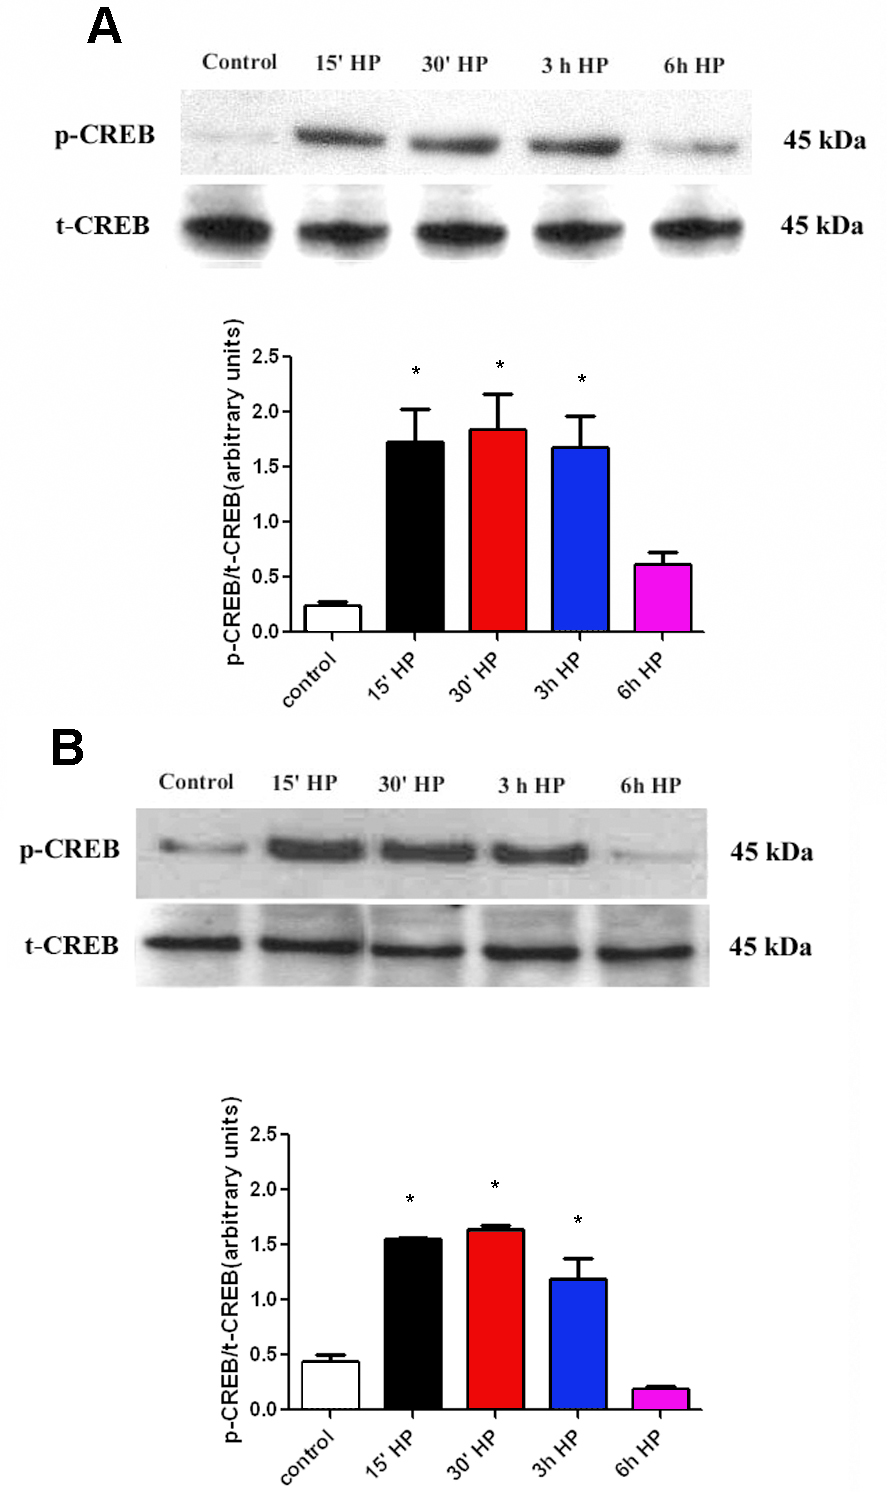
 Figure 2 of
Chen, Mol Vis 2009; 15:1664-1672.
Figure 2 of
Chen, Mol Vis 2009; 15:1664-1672.