Figure 3. Western-blot results. A: A typical western blot image against vitamin D-binding protein (DBP) in CSF of 15 NMO patients: 1–3 were from NMO patients
and 4–6 were from controls. B: Densitometric analysis of DBP bands in the two groups. Each column represents the mean±standard deviation (n=15). The average
density value of the NMO group was 77±3.87, and the average density value of the control group was 117±5.45 (p<0.01). DBP
level was reduced in NMO by 34% as compared to control samples
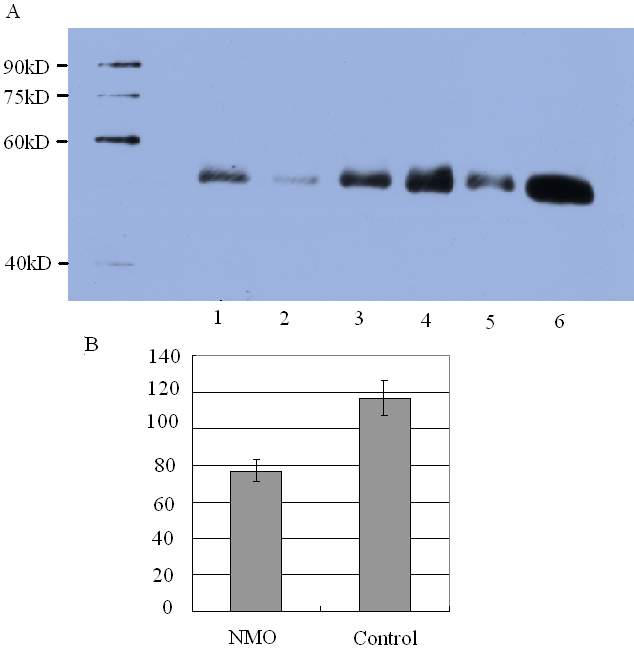
 Figure 3 of
Bai, Mol Vis 2009; 15:1638-1648.
Figure 3 of
Bai, Mol Vis 2009; 15:1638-1648.