Figure 2. Peptide mass fingerprint spectrum of alpha-1β-glycoprotein. The x-axis represents the mass-to-charge ratio (m/z), and the
y-axis represents the relative abundance. A1-A6 show the identified peptide fragments (A1: CLAPLEGAR; A2: LETPDFQLFK; A3:
HQFLLTGDTQGR; A4: CEGPIPDVTFELLR; A5: LELHVDGPPPRPQLR; A6: VTLTCVAPLSGVDFQLR).
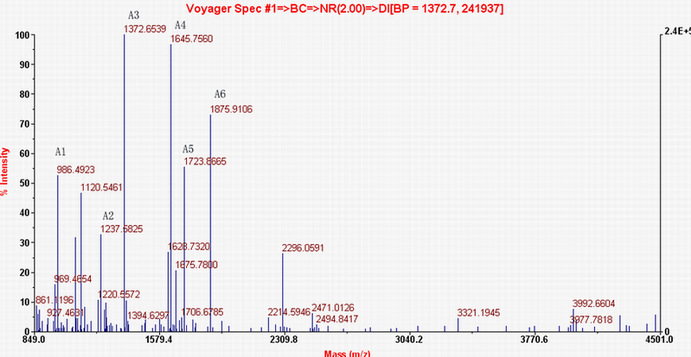
 Figure 2 of
Bai, Mol Vis 2009; 15:1638-1648.
Figure 2 of
Bai, Mol Vis 2009; 15:1638-1648.