Figure 1. 2-DE results. A representative two-dimensional electrophoresis (2-DE) gel images of cerebrospinal fluid proteins of neuromyelitis
optica (NMO; A) and control (B). Numbers indicate proteins that were expressed differentially in the two groups. Protein spots 2, 6, 8, 11, and 12 were
upregulated, whereas the other spots were downregulated in the NMO group (A) compared to the control group (B).
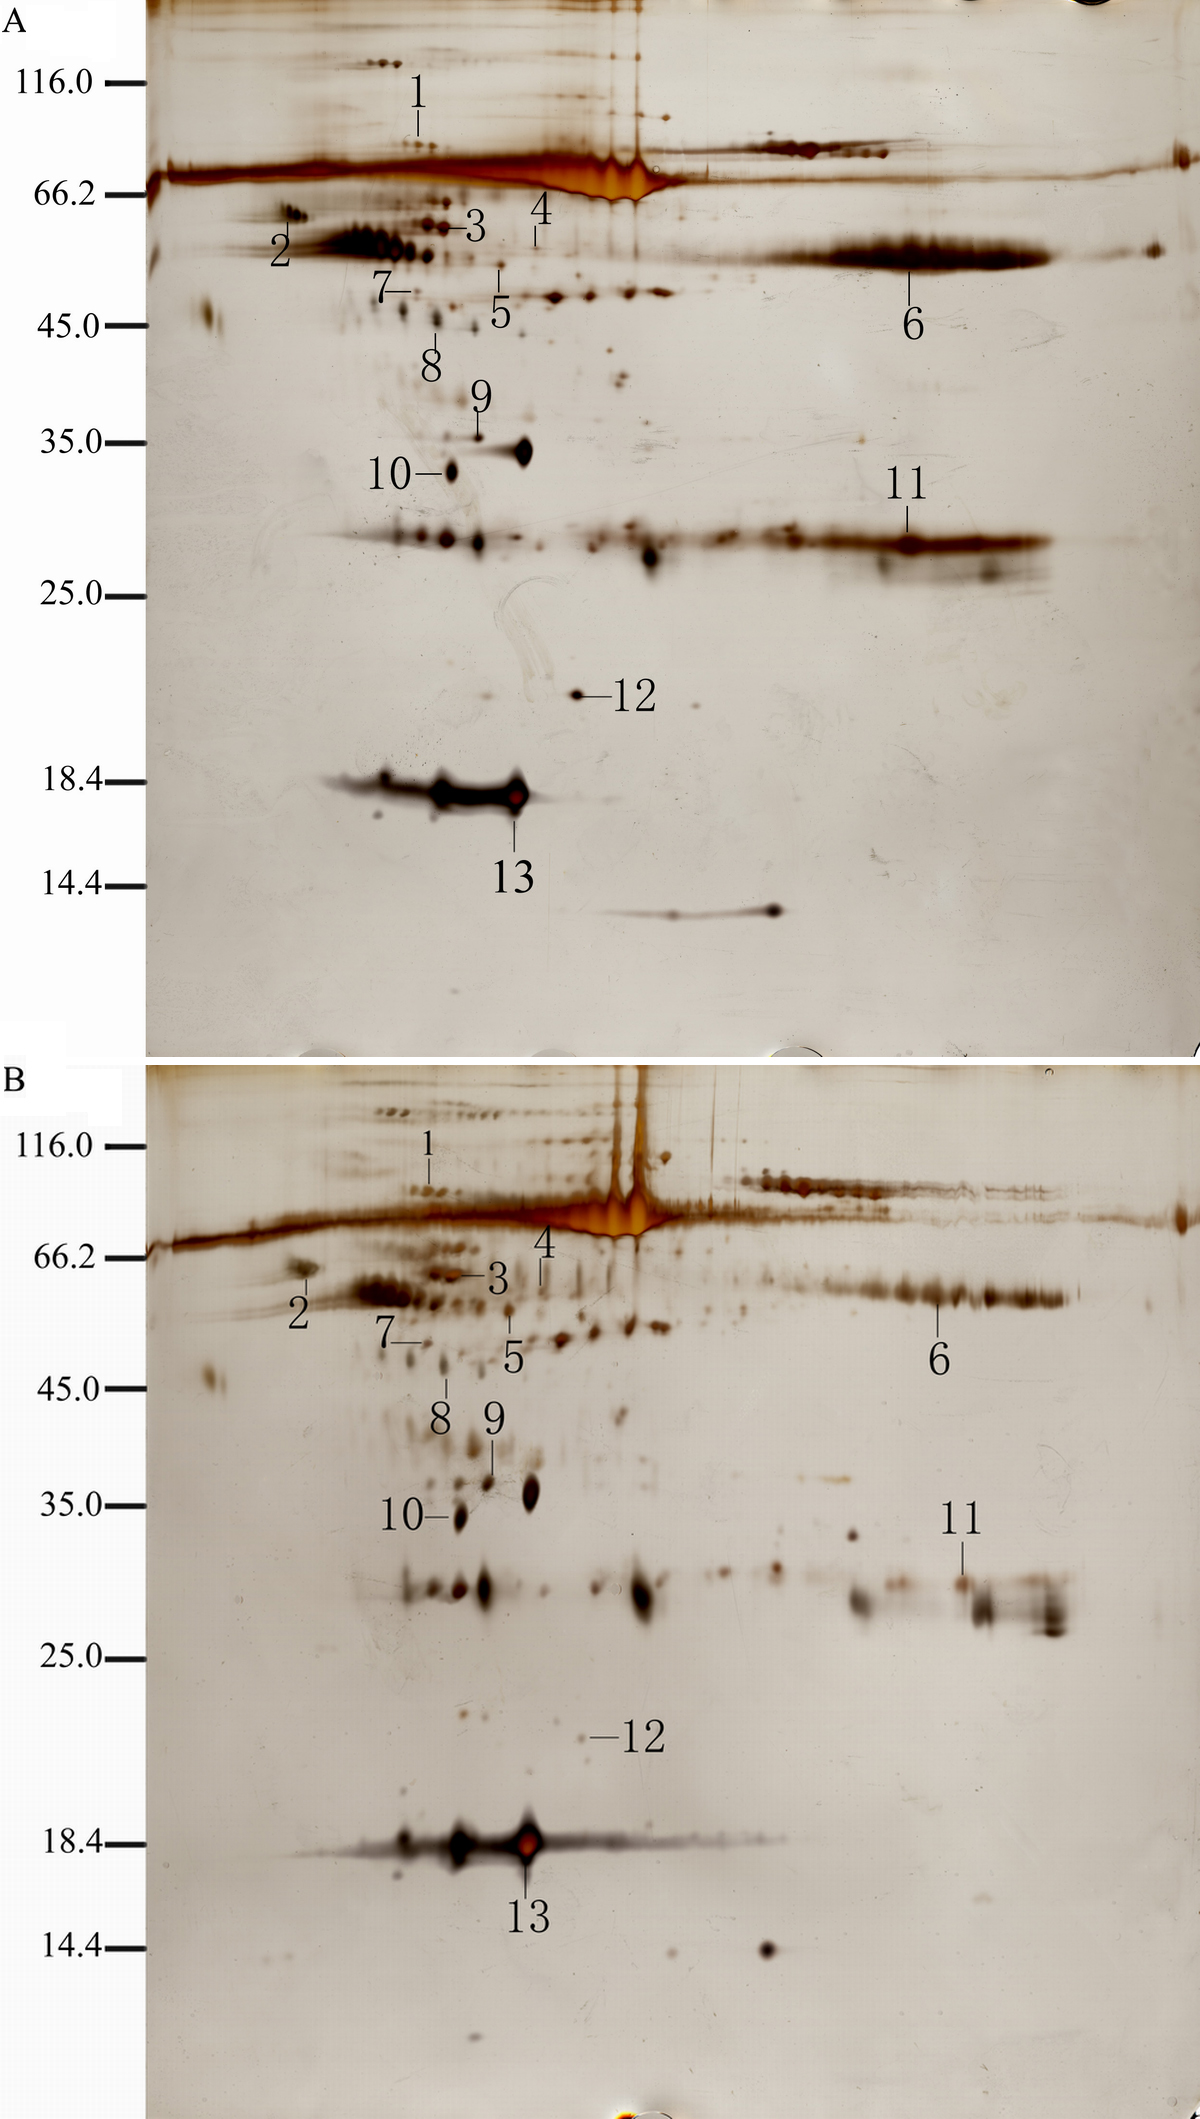
 Figure 1 of
Bai, Mol Vis 2009; 15:1638-1648.
Figure 1 of
Bai, Mol Vis 2009; 15:1638-1648.