Figure 5. Effect of diabetes on the
transcript levels of NMDA receptor subunits. Total RNA extracts were
prepared from rat retinas with one, four, and 12 weeks of diabetes
(black bars) and from age-matched controls (white bars), and the
transcript levels of (A) NR1, (B) NR2C, and (C)
NR3A subunits were analyzed by qPCR. The results represent the
normalized expression levels for each subunit, as explained in Methods,
and are presented as the mean±SEM, for the indicated number of animals.
The asterisk indicates a p<0.05, significantly different from
control, using the two-tailed Student’s t-test.
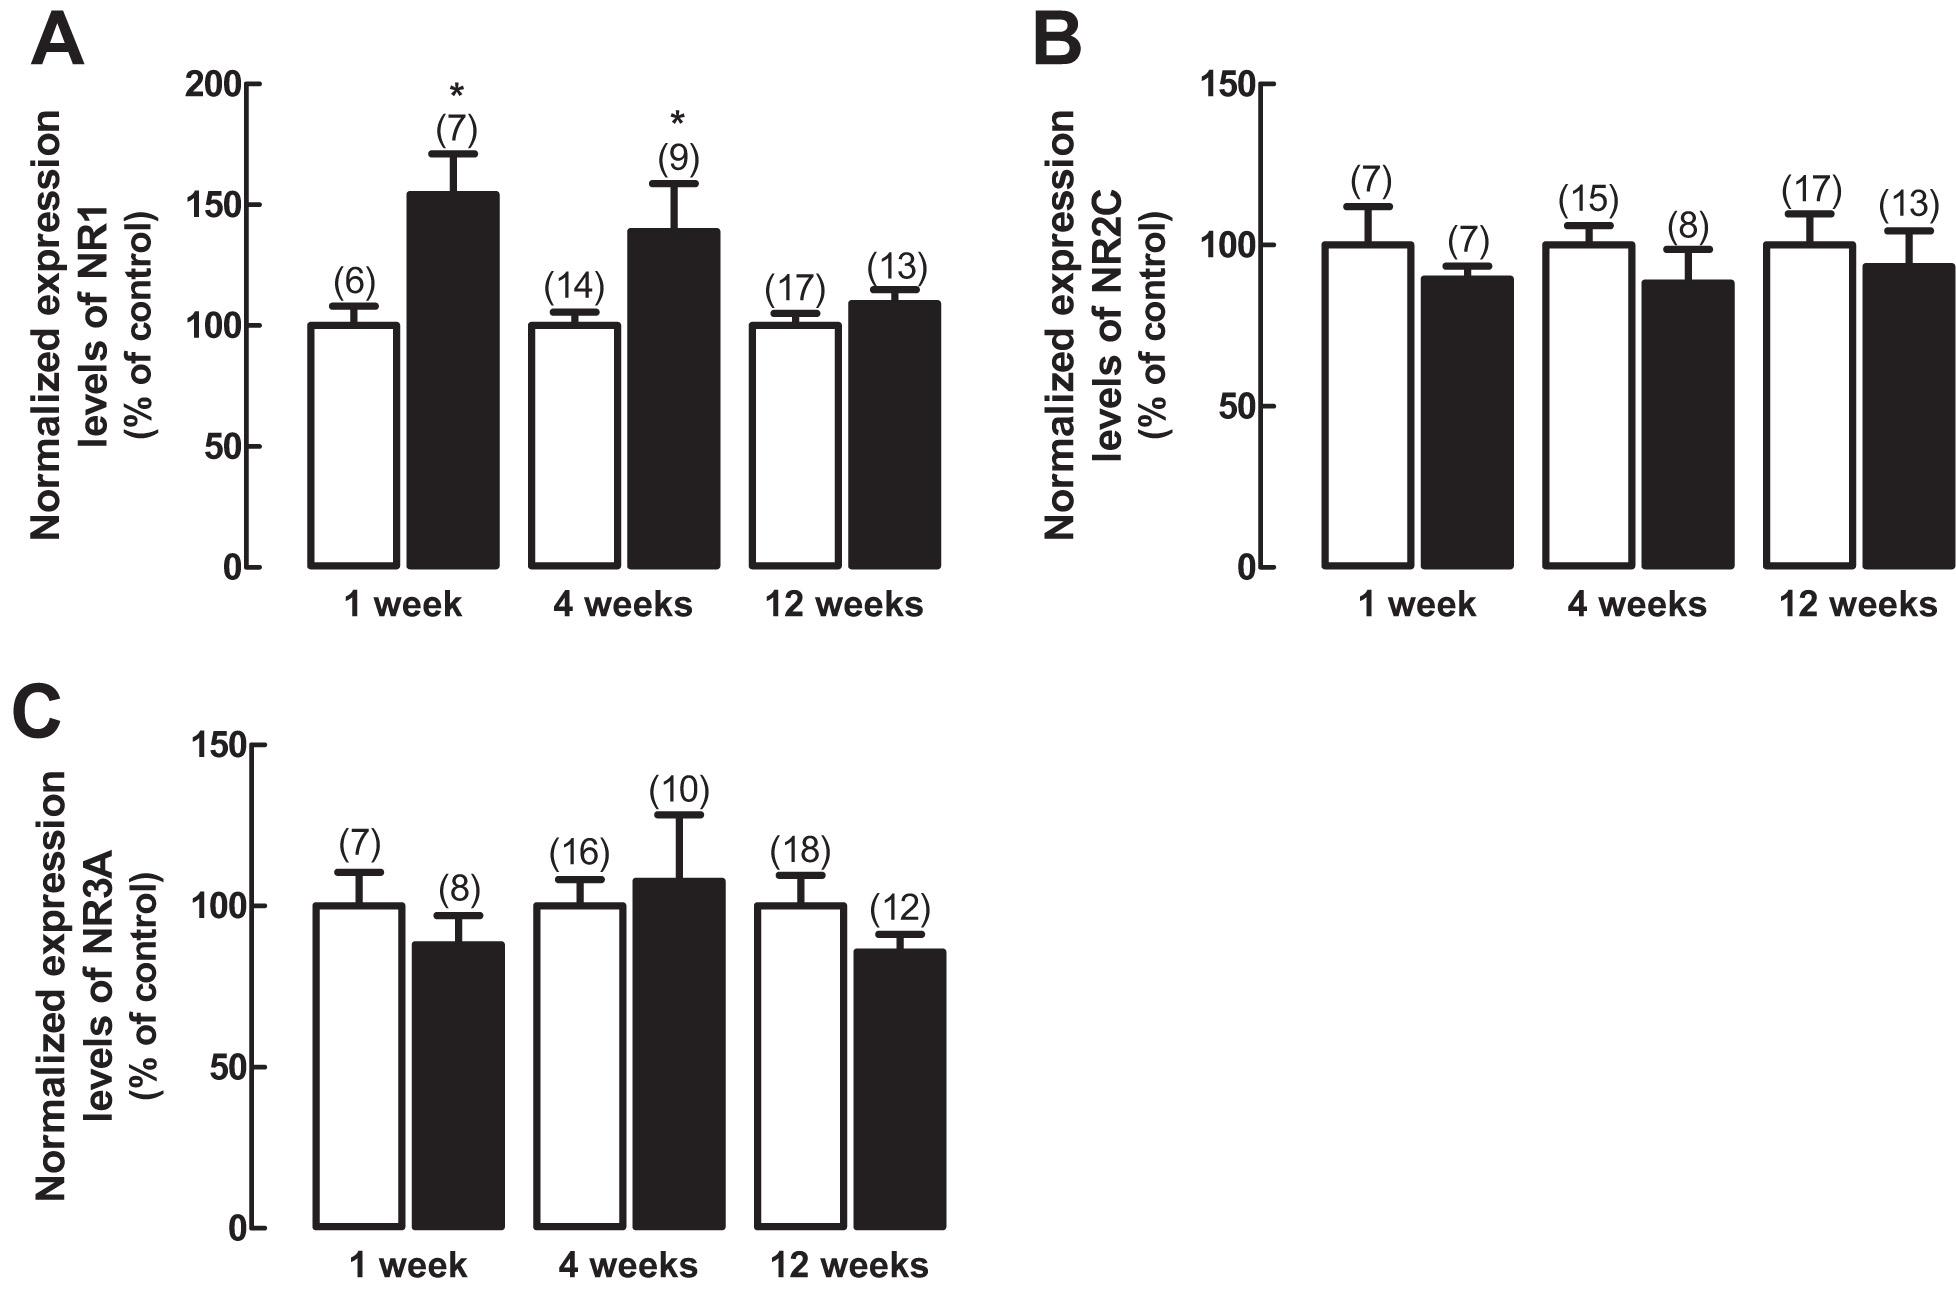
 Figure 5 of Santiago, Mol Vis 2009; 15:1620-1630.