Figure 1. Effect of diabetes on the
protein levels of AMPA receptor subunits. Total retinal extracts were
obtained from rat retinas with diabetes for one, four, and 12 weeks
(black bars) and from age-matched control rats (white bars). Extracts
were assayed for (A) GluR1, (B) GluR2, (C)
GluR2/3, and (D) GluR4 subunits immunoreactivity by western blot
analysis. Representative western blots are presented above the bars for
each time point tested. The densitometry of each band was analyzed. The
results are expressed as percentage of age-matched controls and are
presented as the mean±SEM, for the indicated number of animals. In each
western blot analysis, a reprobing for detection of α-tubulin was
performed to confirm that similar amounts of protein were applied to
the gel. The asterisk indicates a p<0.05, the double asterisk
indicates a p<0.01, and the triple asterisk indicates a p<0.001,
significantly different from control, using the two-tailed Student’s t-test.
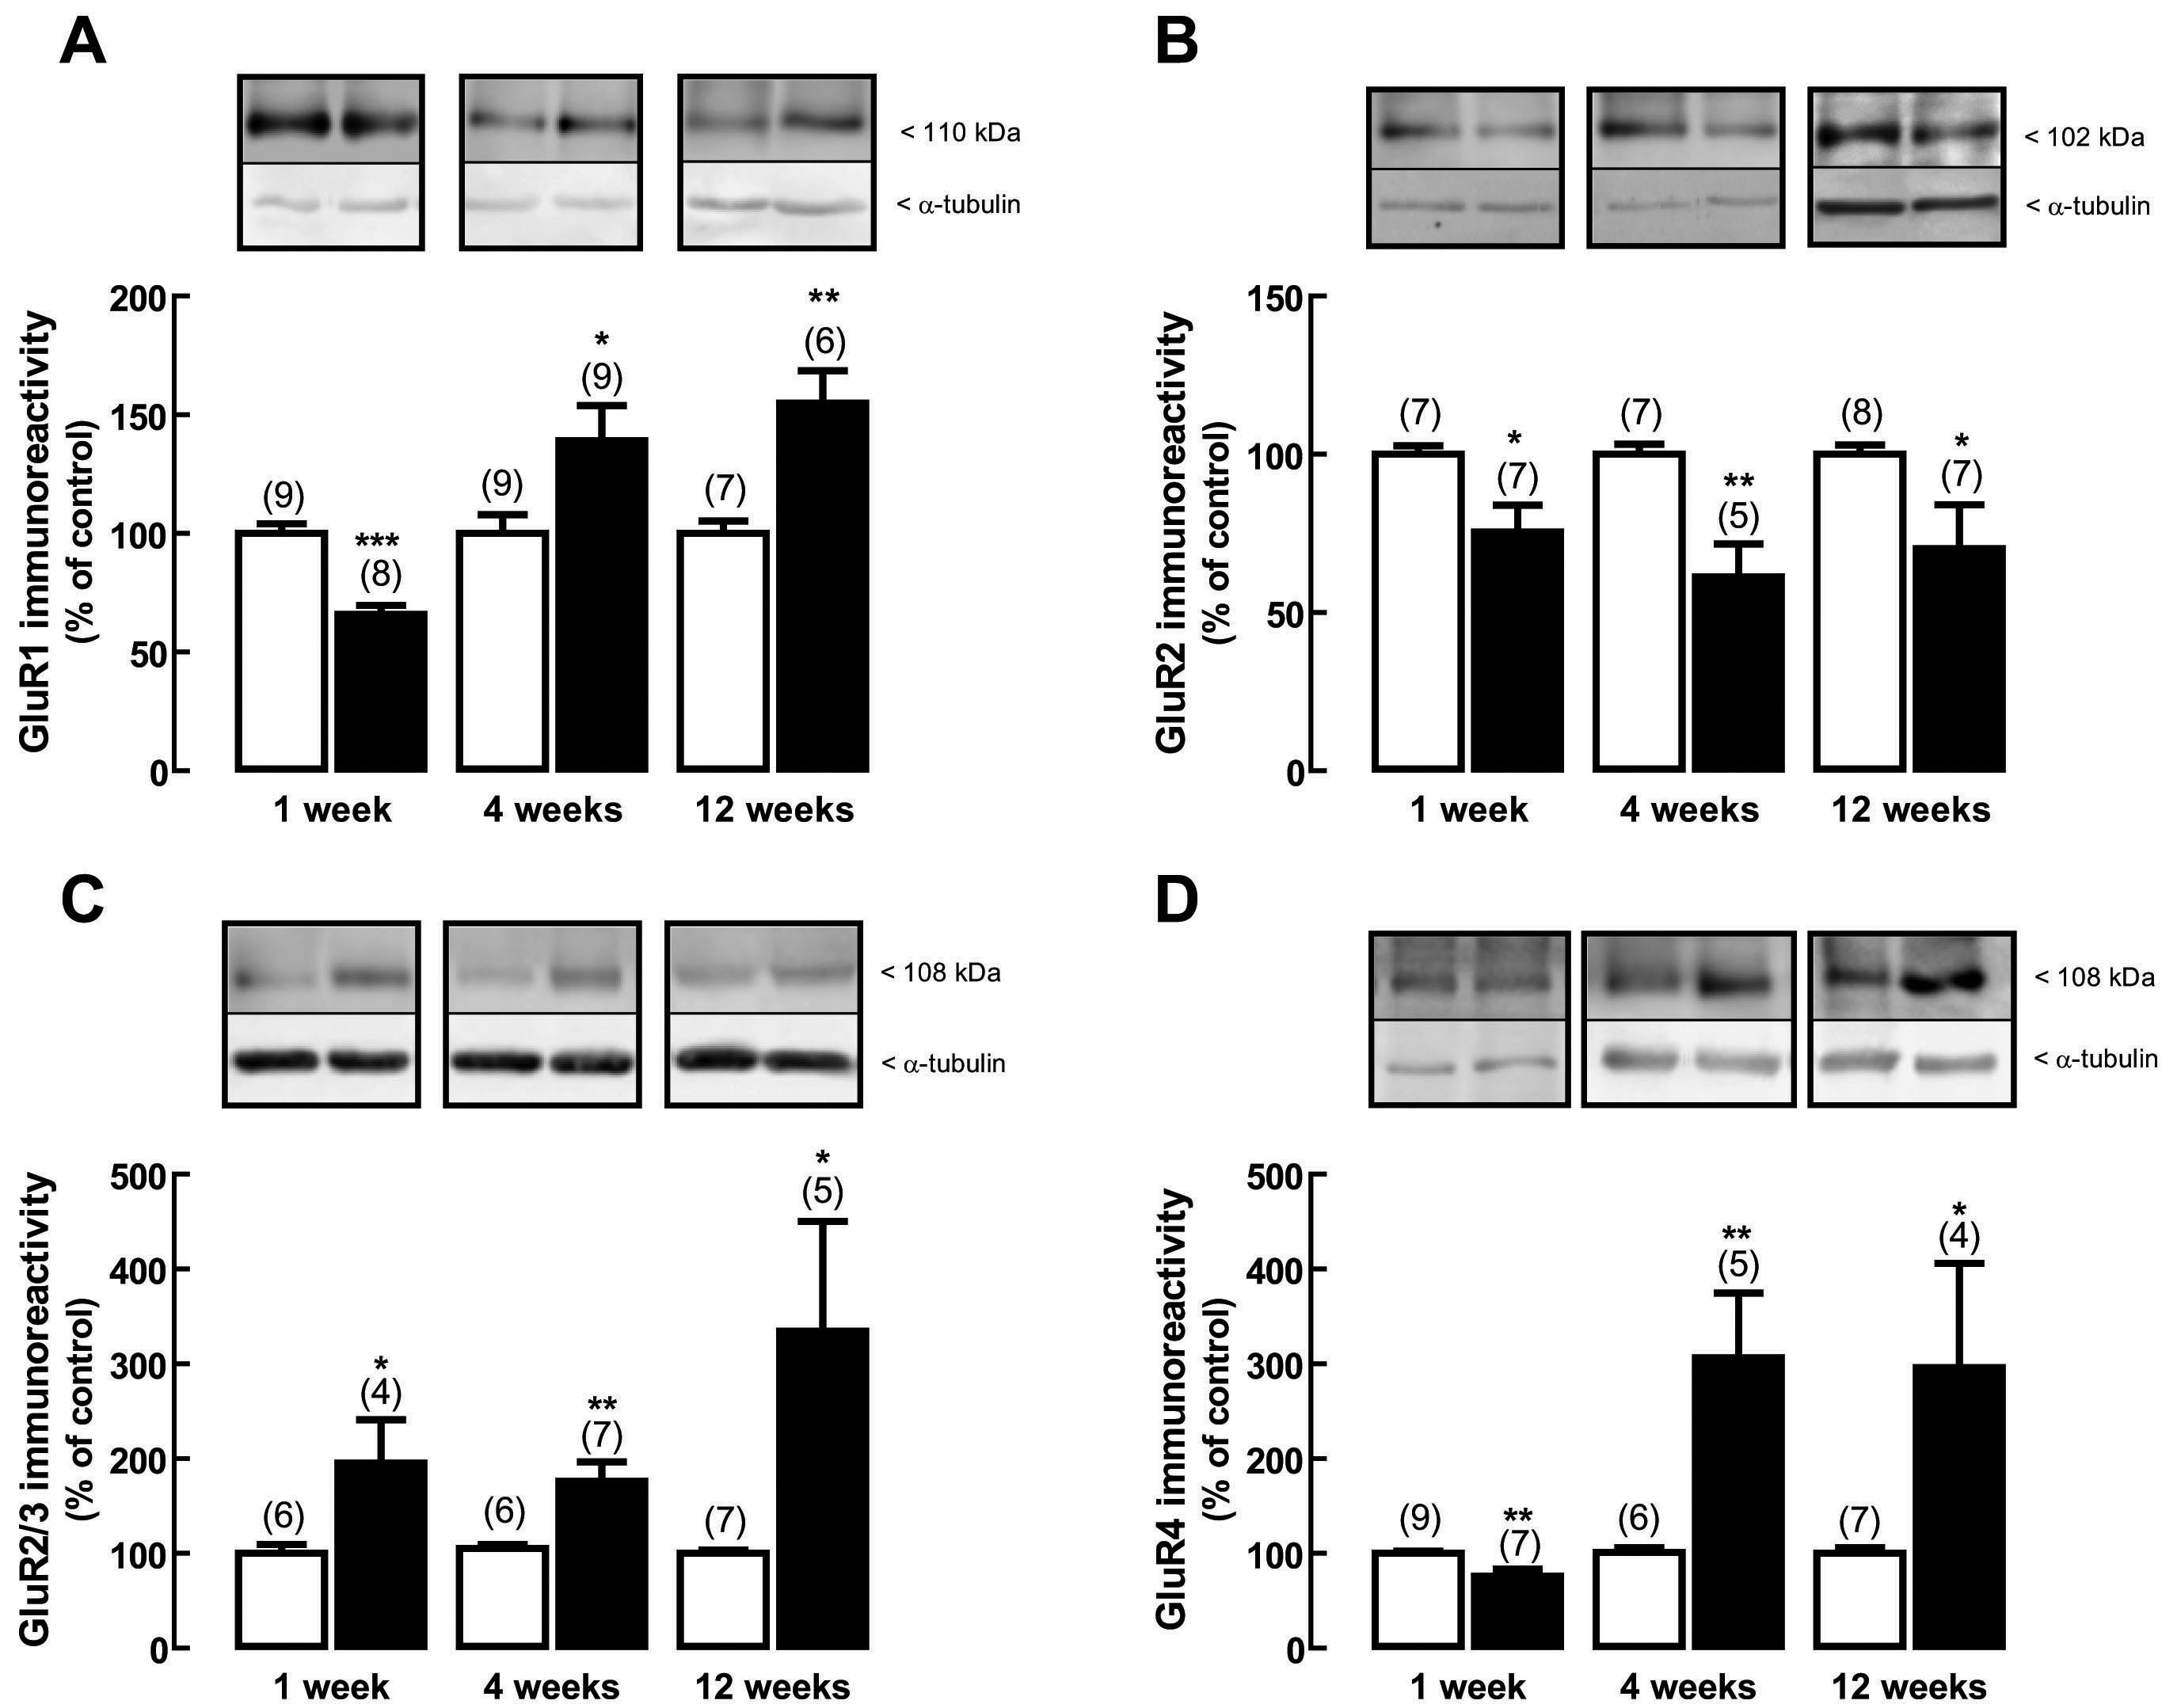
 Figure 1 of Santiago, Mol Vis 2009; 15:1620-1630.