Figure 7. Time-dependent effects of
imatinib on PDGF-induced versus insulin-induced PI 3-kinase.
Serum-deprived (24 h) RGC-5 cells were pretreated without (control) or
with 10 µM imatinib for increasing time intervals (3 h and 24 h).
Subsequently, control and imatinib-treated cells were stimulated with
either 30 ng/ml PDGF or 30 nM insulin for 6 min. The cell lysates were
subjected to immunoprecipitation followed by PI 3-kinase assays or
immunoblot analysis (A and B-E) using the indicated
primary antibodies (see Methods). The representative thin layer
chromatogram and the immunoblots for imatinib regulation of
PDGF-induced PI 3-kinase activity (A) and insulin-induced PI
3-kinase activity (B-E) are shown. Note: For data analyses,
PDGF- or insulin-induced PI 3-kinase activity in the absence of
imatinib was normalized to 100%. The respective bar graphs shown are
the mean±SEM values from 3 to 4 experiments. The asterisk indicates a
p<0.05 compared with the respective PDGF-induced PI 3-kinase
activity.
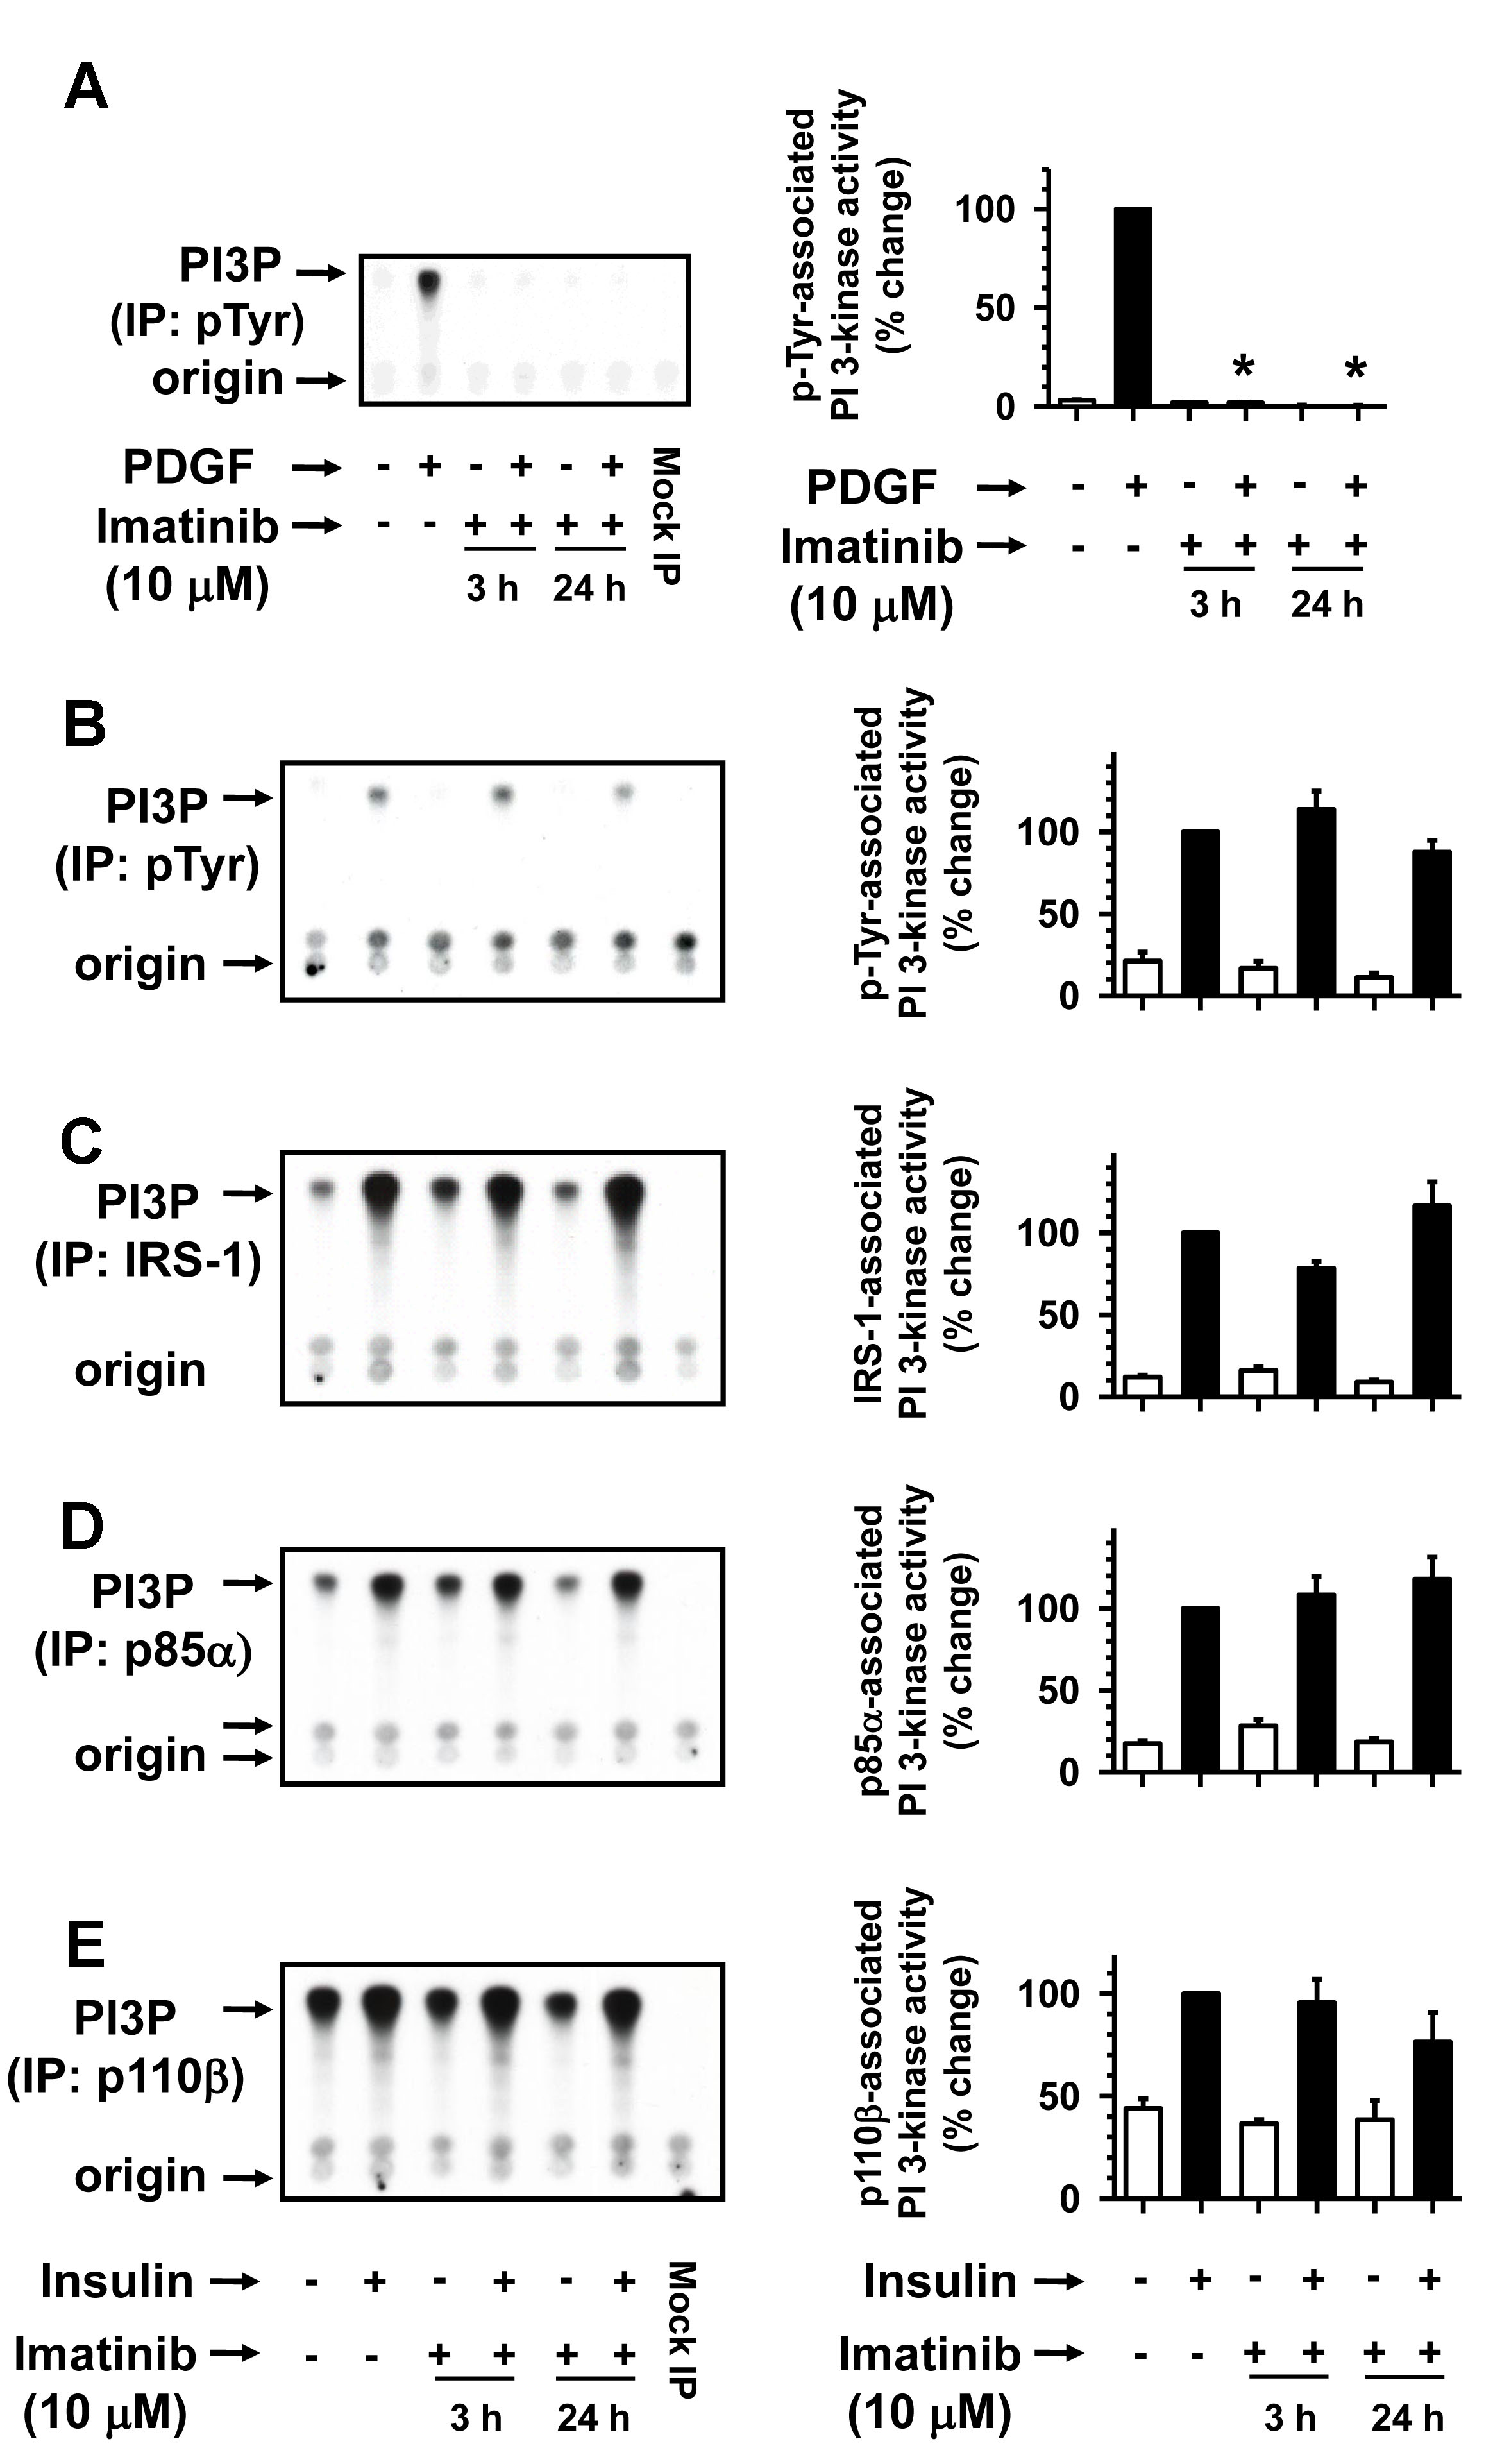
 Figure 7 of Biswas, Mol Vis 2009; 15:1599-1610.