Figure 3. Concentration-dependent effects
of imatinib on PDGF-induced versus insulin-induced receptor
phosphorylation. Serum-deprived (24 h) RGC-5 cells were pretreated
without (control) or with increasing concentrations of imatinib (0.1 µM
to 30 µM) for 30 min. Subsequently, control and imatinib-treated cells
were stimulated with either 30 ng/ml PDGF or 30 nM insulin for 6 min.
The cell lysates were subjected to immunoblot analysis for receptor
tyrosine phosphorylation (A, B) using the indicated primary
antibodies (See Methods). To normalize the changes in protein
phosphorylation in the immunoblots, β-actin was used as an internal
control. Note: For data analyses, PDGF- or insulin-induced receptor
phosphorylation in the absence of imatinib was normalized to 100%. The
respective linear graphs shown are the mean±SEM values from 3
experiments. The asterisk denotes a p<0.05 compared with the
respective PDGF-induced receptor phosphorylation.
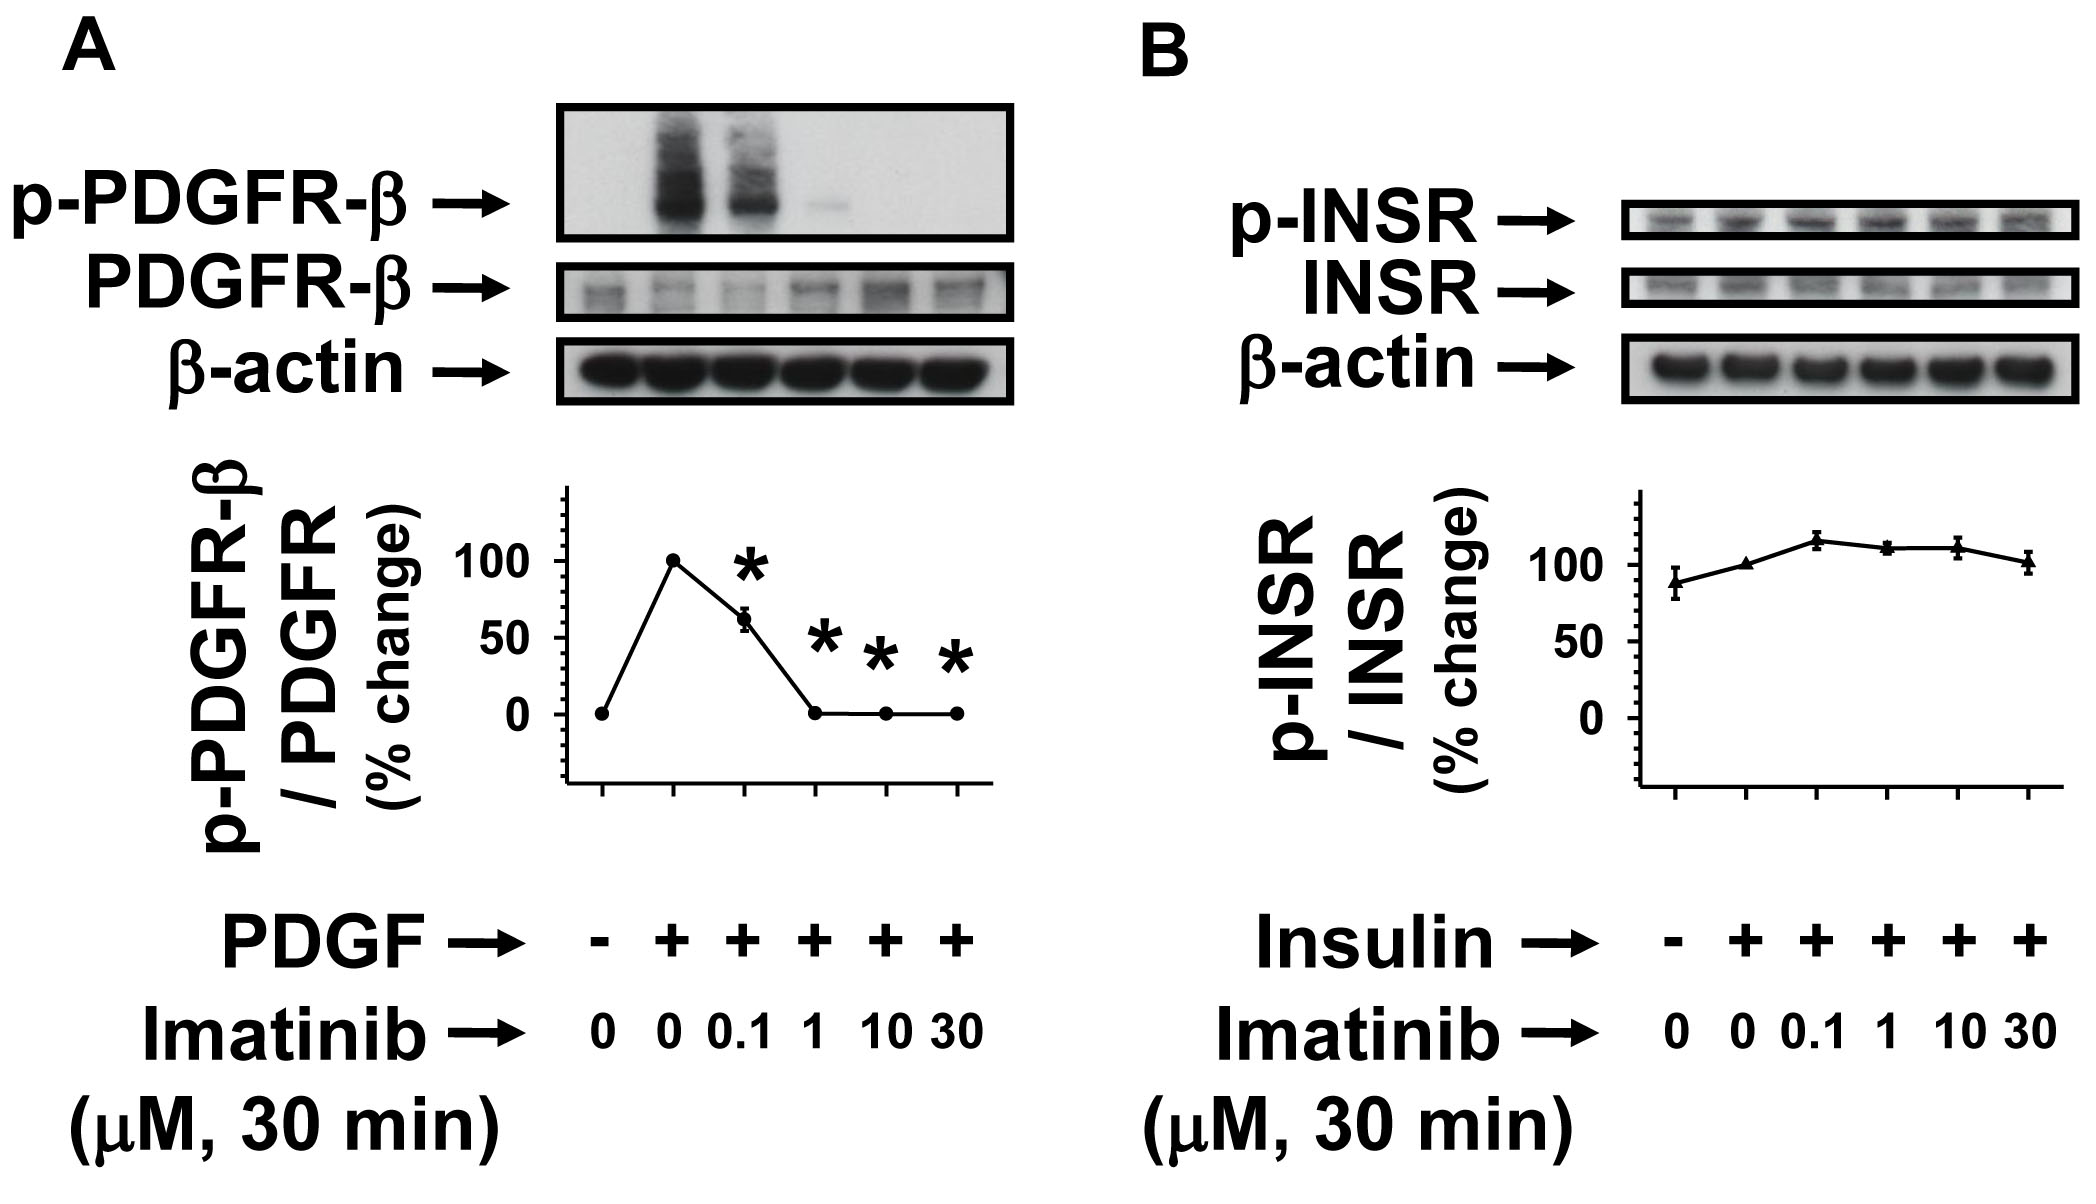
 Figure 3 of Biswas, Mol Vis 2009; 15:1599-1610.