Figure 2. Array CGH results for POAG
patients versus controls. Chromosomes shown were chosen randomly as
representative of all chromosomes and in all POAG patients tested. In
the image, A indicates Chromosome 1; B indicates
Chromosome 13; C indicates Chromosome 15; and D
indicates Chromosome 18. When control DNA was hybridized against POAG
DNA, a signal ratio of zero (0) was obtained, indicating the absence of
chromosomal copy number alterations.
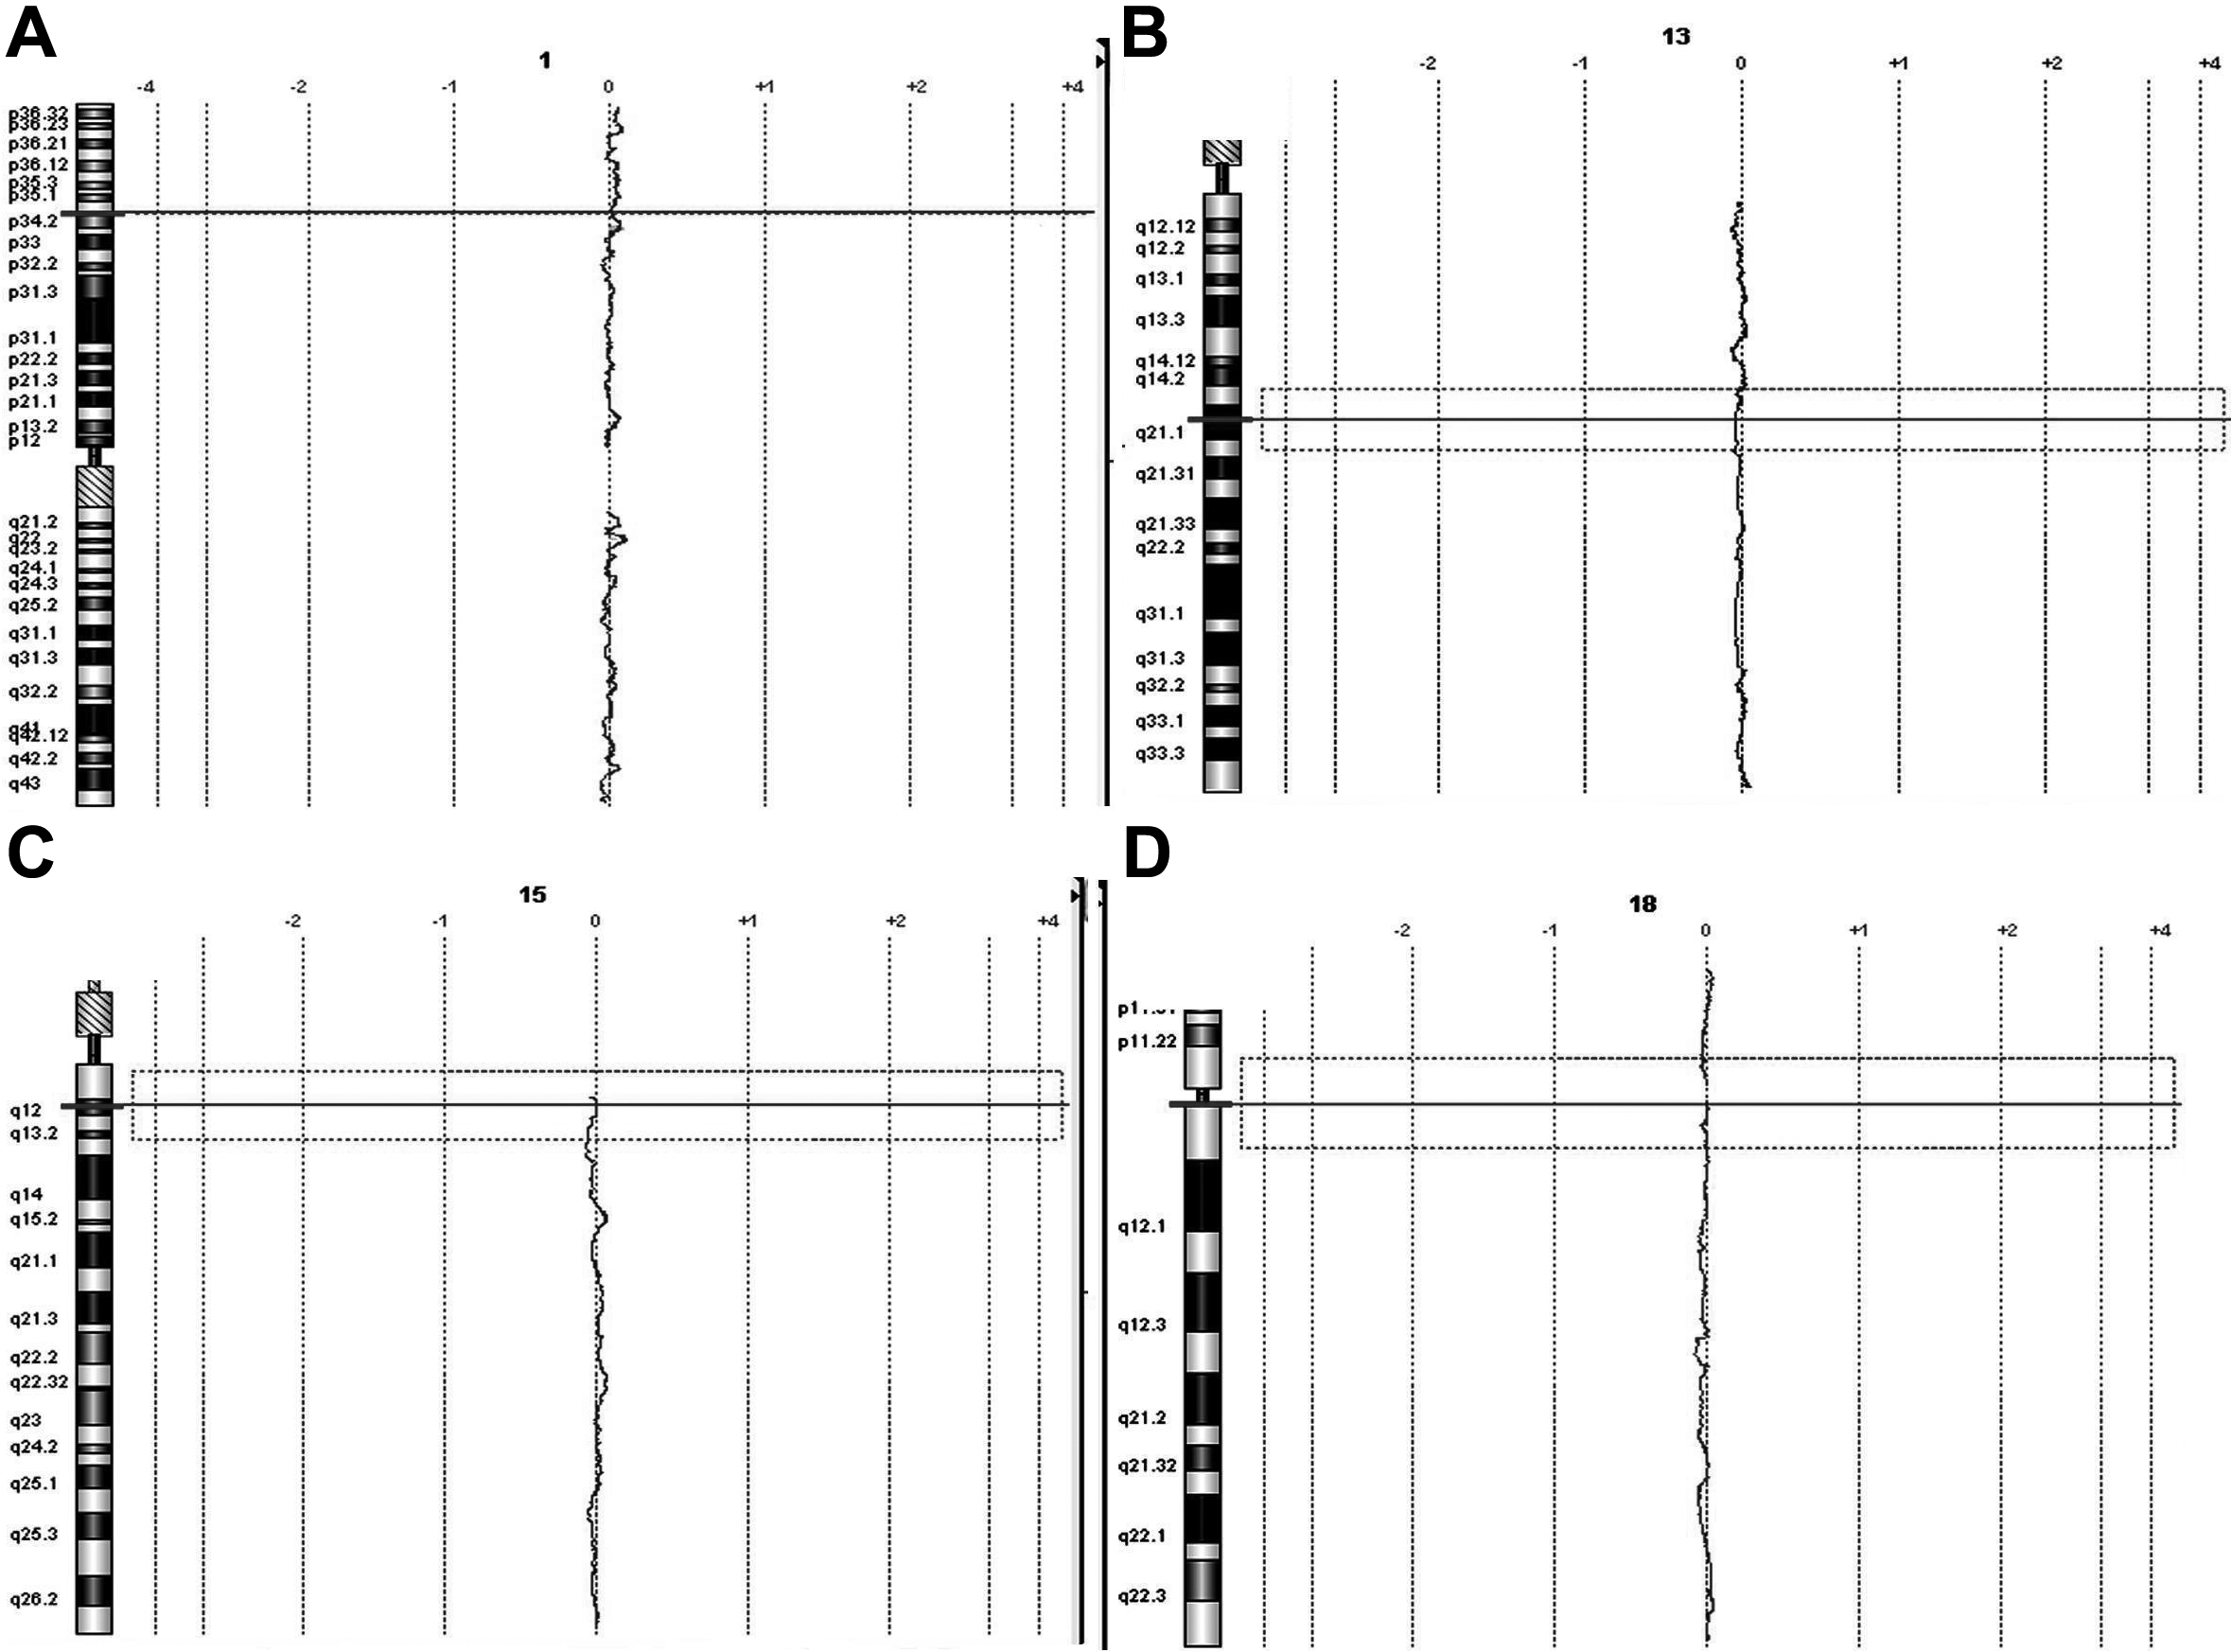
 Figure 2 of Abu-Amero, Mol Vis 2009; 15:1594-1598.