Figure 2 of
Kobayashi, Mol Vis 2009; 15:1589-1593.
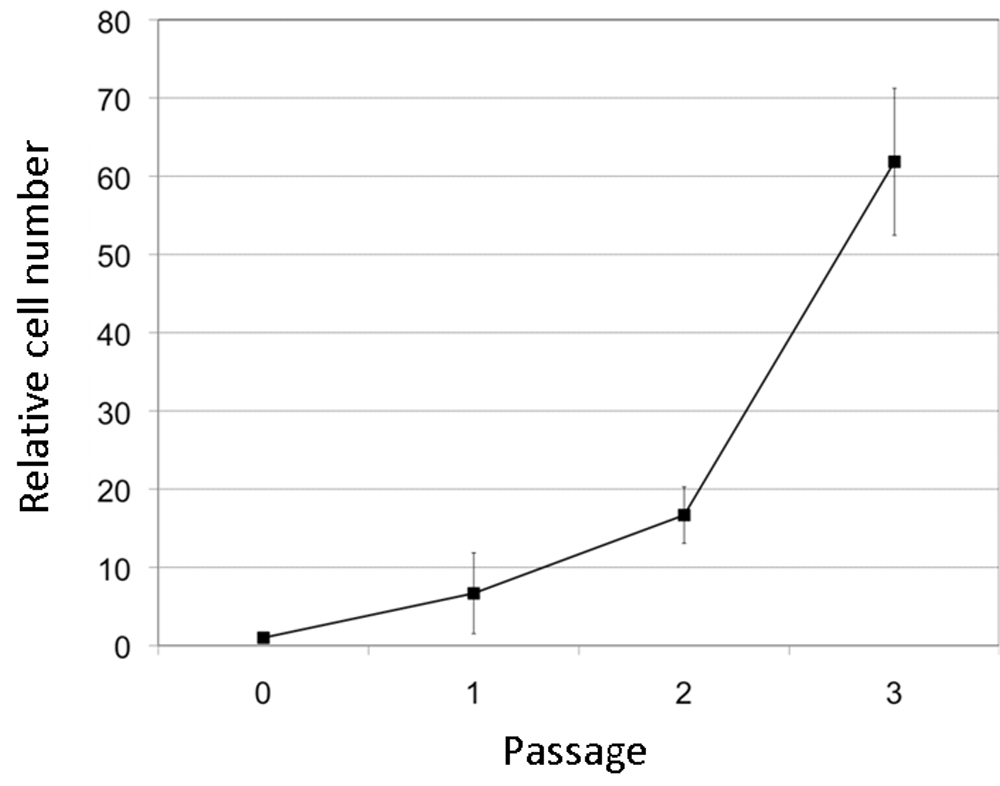
Figure 2.
Growth of MCECs cultured in CnT-50. Each point is the mean of five individual experiments. The number of cells at confluency at each passage was counted and normalized to the number at P0. Error bar represents the standard deviations.
 Figure 2 of
Kobayashi, Mol Vis 2009; 15:1589-1593.
Figure 2 of
Kobayashi, Mol Vis 2009; 15:1589-1593.