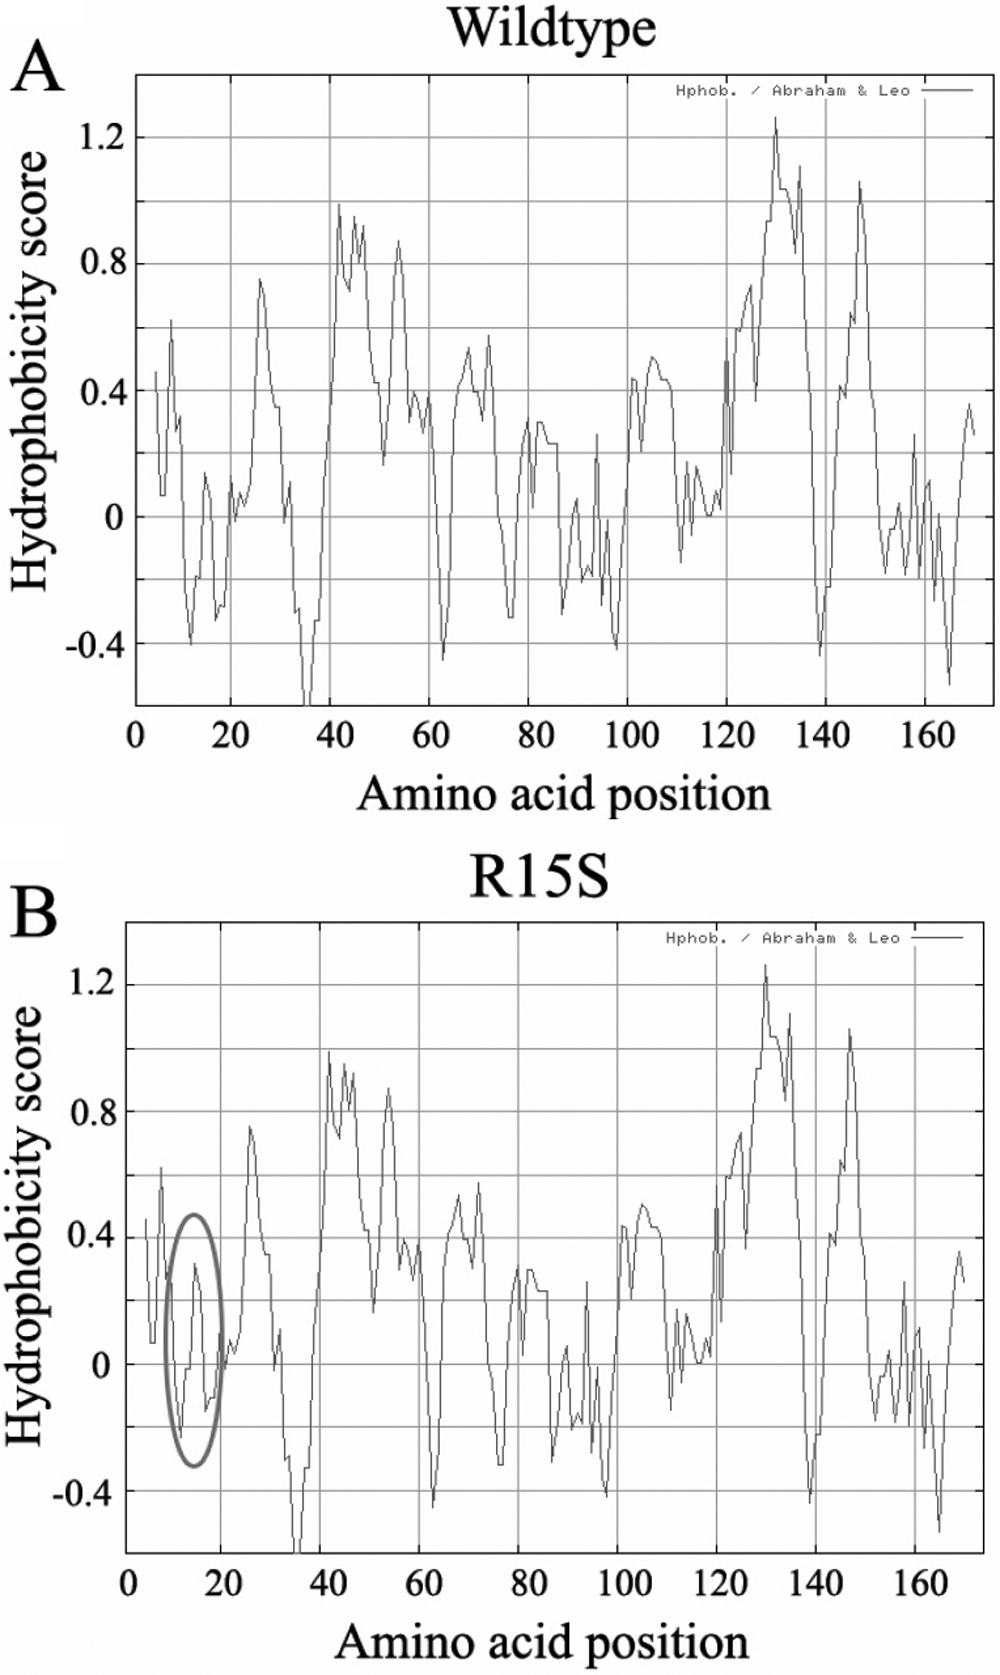
Figure 3. Hydrophobicity change of R15S CRYGD. The prediction by
ProtScale analysis at
Expasy indicated an increase of local hydrophobicity around the site of R15S mutation (Circle in panel
B).
A: The curve showed the hydrophobicity score of each amino acid of wildtype CRYGD.
B: The curve was the hydrophobicity of R15S CRYGD. At the position of the 15th amino acid and its neighboring locations, the
hydrophobicity scores increased which was indicated by the circle.
 Figure 3 of
Zhang, Mol Vis 2009; 15:1521-1529.
Figure 3 of
Zhang, Mol Vis 2009; 15:1521-1529.