Figure 3. RMECs growing on AGE-FN show
enhanced JC-1 mitochondrial permeability A-D: Cells grown on
native FN (A) were gated to exclude cell debris in a forward
scatter versus side-scatter dot plot. This dot plot is expressed in
terms of both the red and green fluorescence intensity after JC-1
incubation (B). The histogram charts the green (C) and
red (D). E-H: The same gating schemes were used for
RMECs growing on AGE-FN. Typical traces are shown from RMECs on AGE-FN
(100 µM MGO) and demonstrate that AGE-exposed cells showed shrinkage,
indicating apoptosis (compare A with E). There is also
a relative increase in mitochondrial permeability in AGE-exposed cells
as indicated by the net decrease in the red:green fluorescence
intensity ratio (E-H). I: Quantification of JC-1
fluorescence revealed that RMECs cultured on AGE-FN (modified by 10–100
µM MGO) showed a significant increase in mitochondrial permeability
(red:green fluorescence intensity ratio) in comparison to cells grown
on native FN. (n=3; *p<0.05; comparison between AGE-FN and native
FN).
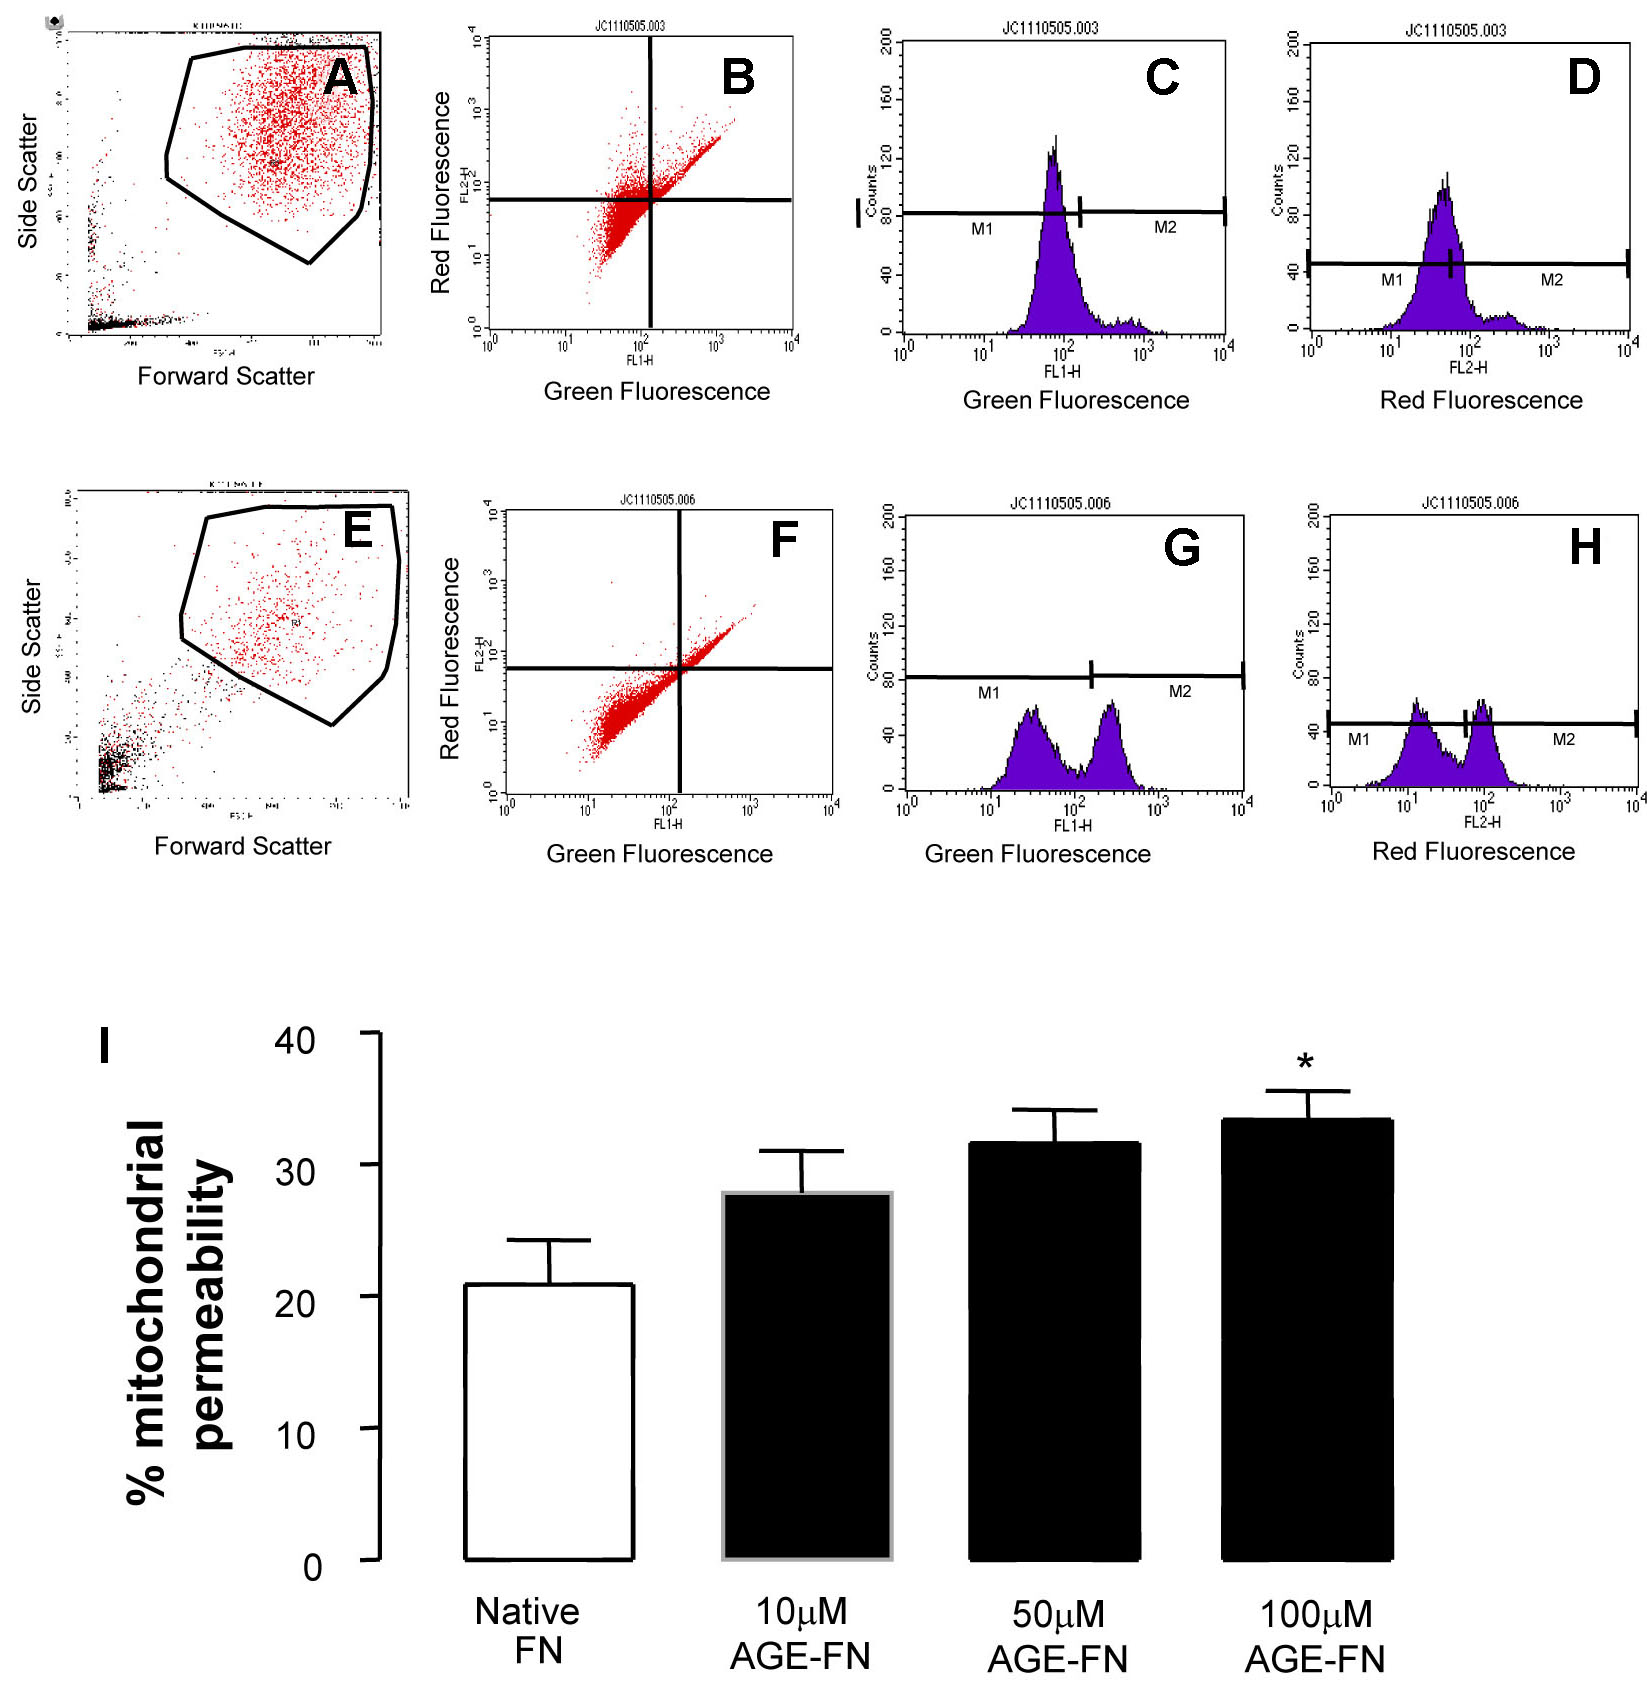
 Figure 3 of McDonald, Mol Vis 2009; 15:1509-1520.