Figure 6. Cells overexpressing CERKL
showed no mortality increase in a comparison of normal and oxidative
stress conditions. A: The histogram shows the mortality
(depicted as percentage) of pyknotic nuclei of COS-7 cells. Cells were
transfected with either the wild-type CERKL isoforms (named CERKLa to
CERKLd), the truncated RP form (R257X), CERK or the empty vector
(negative control) and grown in either normal conditions (dotted bars)
or treated for 4 h with 200 μM H2O2 (solid bars).
There was no increase in mortality when the cells were transfected with
any of the wt CERKL isoforms. In contrast, there was an increase in
mortality in cells transfected with, either the empty vector, a CERK
(ceramide kinase) construct or the R257X CERKL mutant. Statistical
significance is shown by an asterisk (Mann–Whitney test, p<0.05). B:
The histogram shows the mortality fold-increase of H2O2-treated
versus untreated cells for each construct. Statistically significant
differences are shown by asterisks (Mann–Whitney test, p<0.05). More
than 500 cells were counted for each construct and condition, in 3
independent replicates.
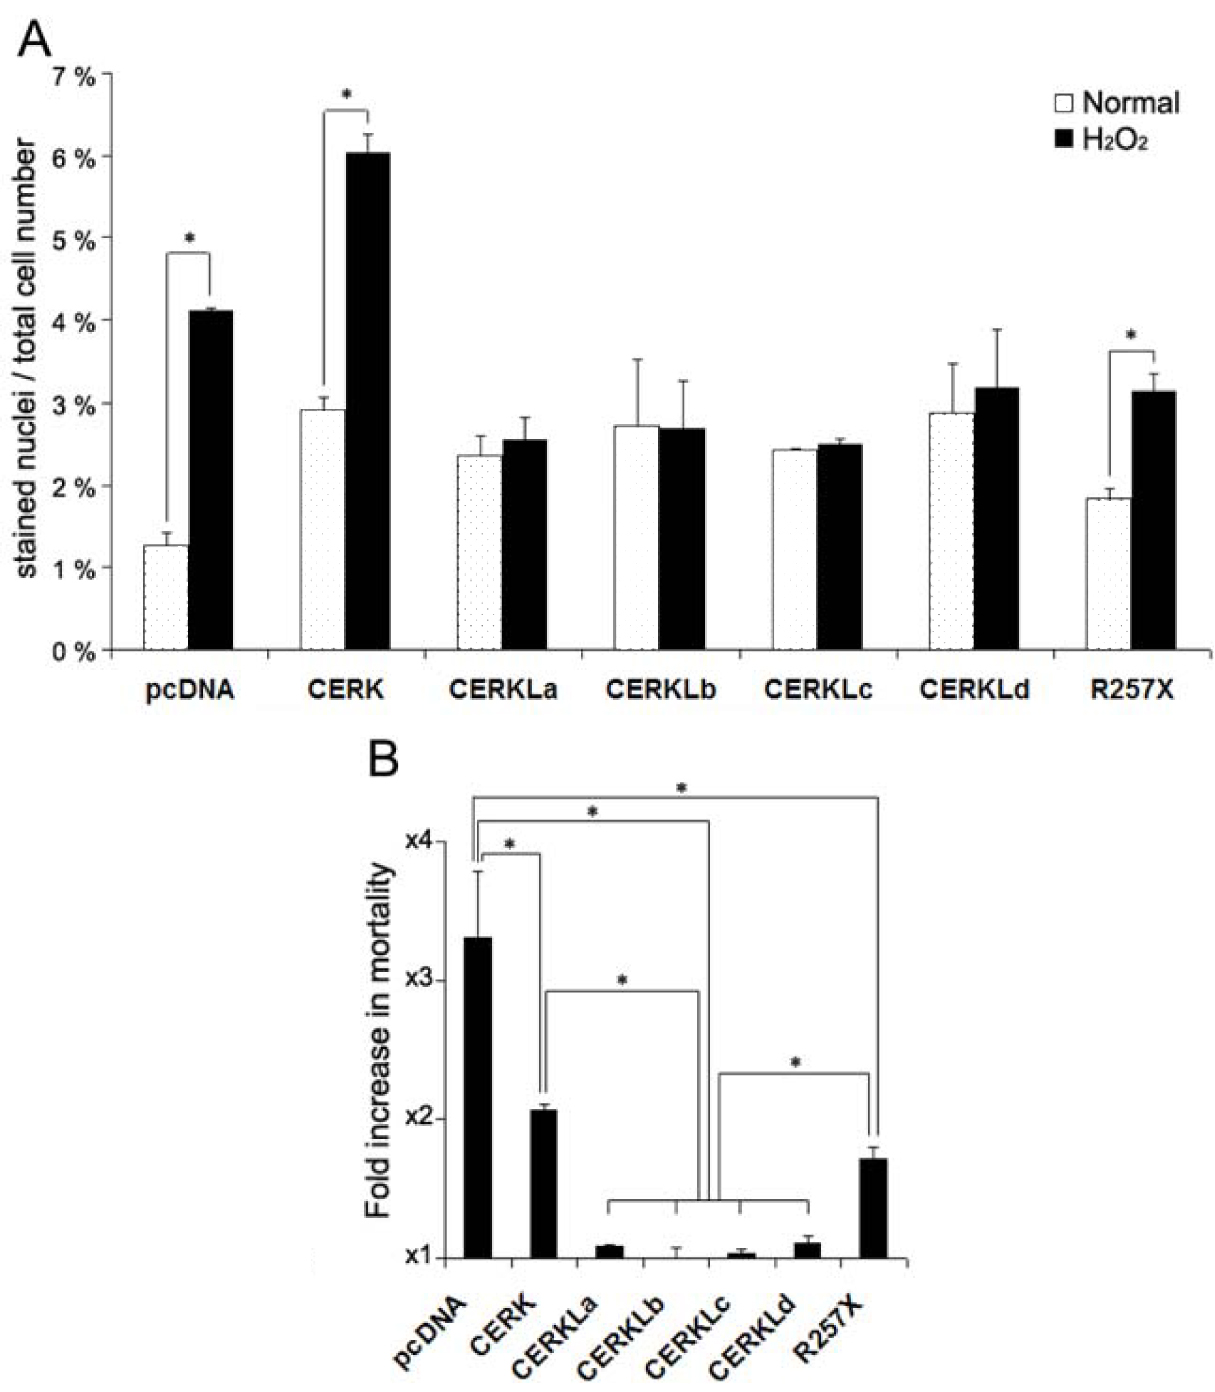
 Figure 6 of Tuson, Mol Vis 2009; 15:168-180.