Figure 4. A schematic overview of the mutations identified in Philly, Aey2, and index II:1 (in our study). The mutation in Philly is indicated by a shaded rectangle; the exchanged amino acid is noted below the sequence in Aey2 and above the sequence in II:1.
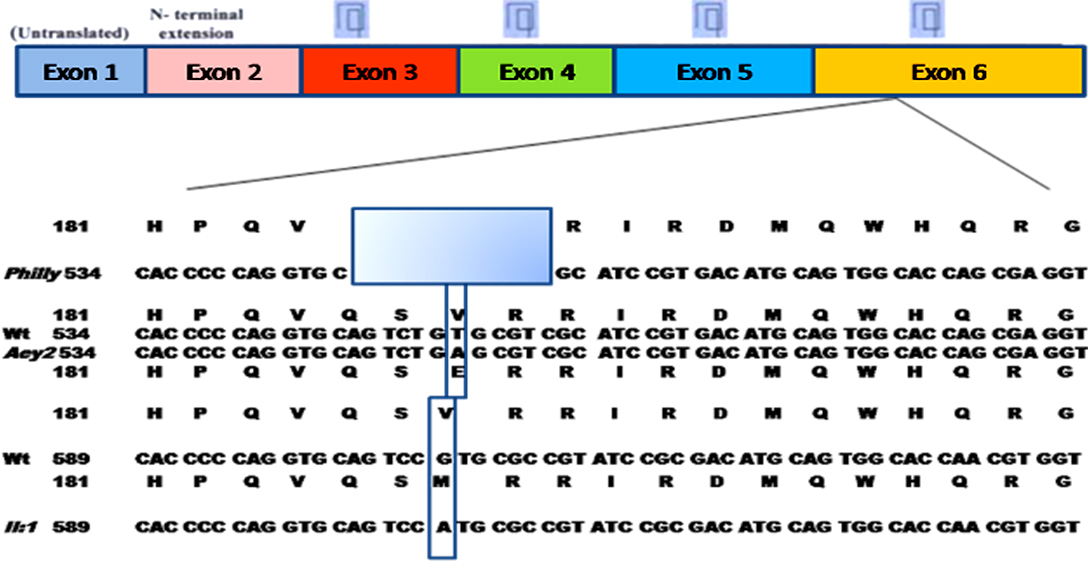
 Figure 4 of
Mothobi, Mol Vis 2009; 15:1470-1475.
Figure 4 of
Mothobi, Mol Vis 2009; 15:1470-1475.