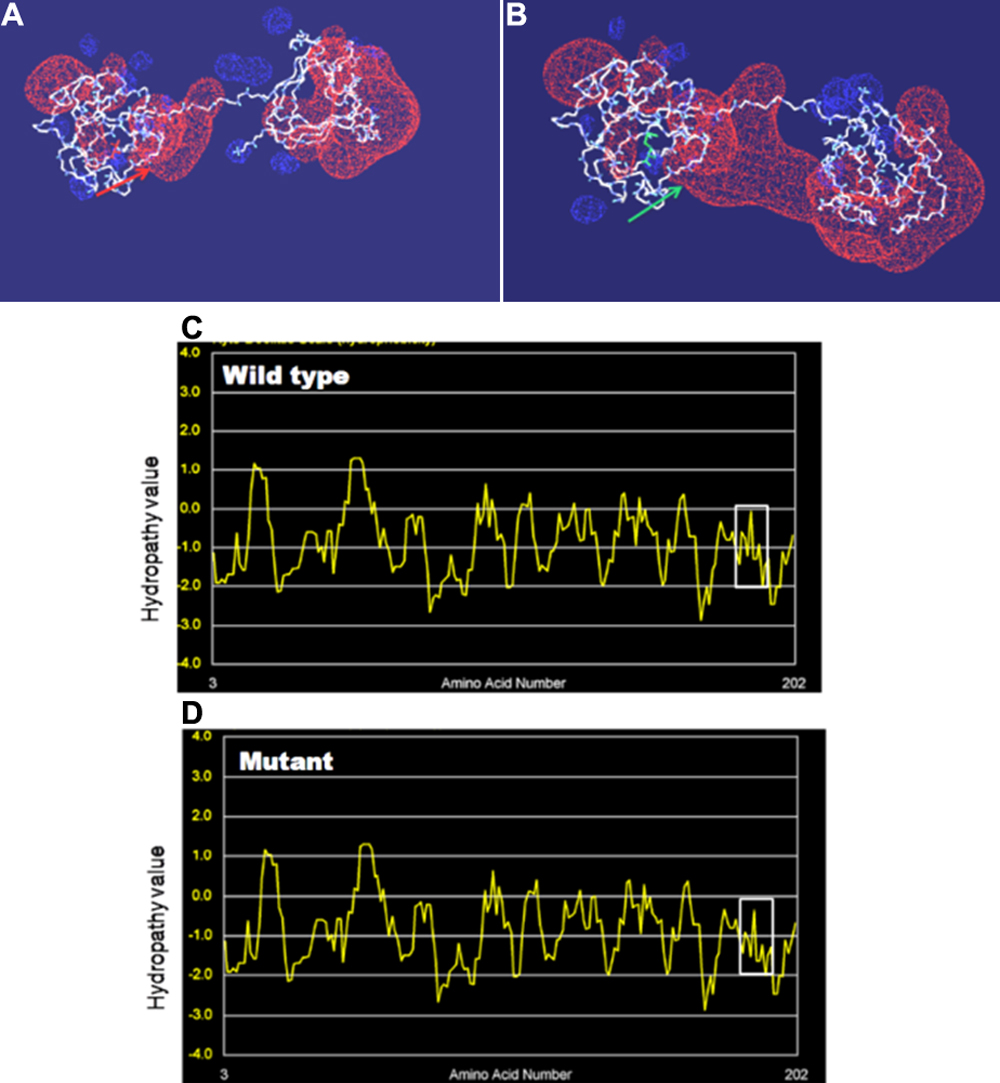
Figure 3. Structural analysis of the mutant protein. The predicted three-dimensional protein structures for CRYBB2
WT (
A) and CRYBB2
V187M (
B), without side chains. The electrostatic potential is displayed in red (negative potential) and blue (positive potential)
clouds. The mutant protein exhibits an unusually large negative electrostatic potential (green arrow). The amino acid V187
in the wild type is marked in red and in the mutant form, M187 is marked in green.
Kyte-Doolittle hydropathy plot of CRYBB2
WT (
C) and CRYBB2
V187M (
D). X-axis represents position of amino acids. Y-axis represents hydropathy value in a default window size of 7.The region
of interest is marked by white boxes. The increase in hydrophilicity in the mutant form is evident.
 Figure 3 of
Mothobi, Mol Vis 2009; 15:1470-1475.
Figure 3 of
Mothobi, Mol Vis 2009; 15:1470-1475.