Figure 1. Family pedigree. The family history revealed five affected members in three generations. The dark symbols represent the affected
members of the family, while the clear symbols indicate the healthy ones. Circles are for female and squares for male family
members. Those who participated in this study are indicated with asterisks. The arrow points to the proband. The pedigree
of the family suggests an autosomal dominant mode of inheritance.
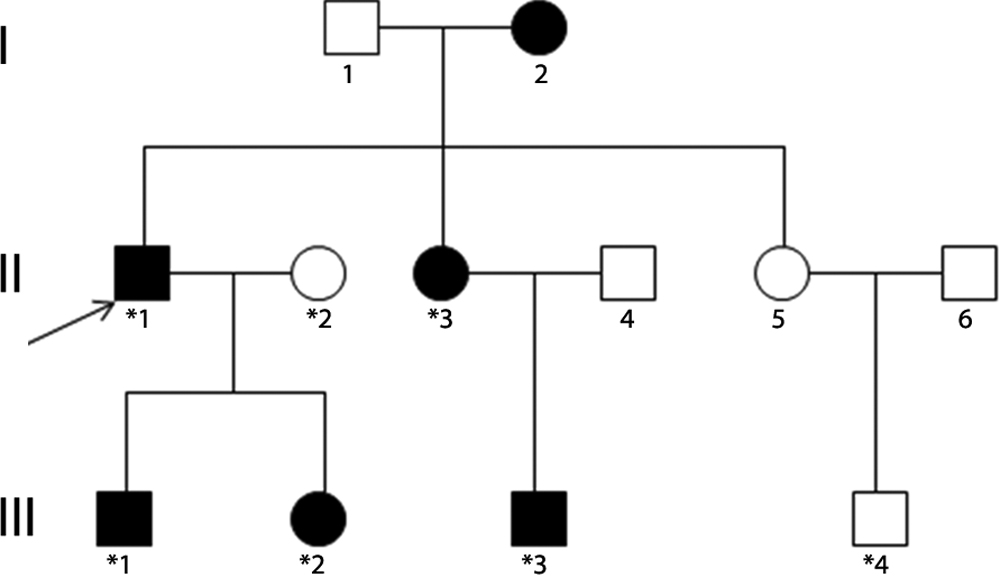
 Figure 1 of
Mothobi, Mol Vis 2009; 15:1470-1475.
Figure 1 of
Mothobi, Mol Vis 2009; 15:1470-1475.