Figure 1. The use of MLGA to detect OTX2 and SOX2 deletions in cases 1-5. Left: GeneMapper® traces demonstrate the reduced signal from an OTX2 deletion (upper) and a SOX2 locus deletion (lower). Right: Bar graphs of normalized peak area ratios show reduced copy numbers of OTX2 (upper) and SOX2 locus (lower) in individuals with deletions when compared to normal controls. A normalized ratio of 0.5 indicates a deletion
of one copy of the targeted loci while a ratio of 1 indicates a normal copy number.
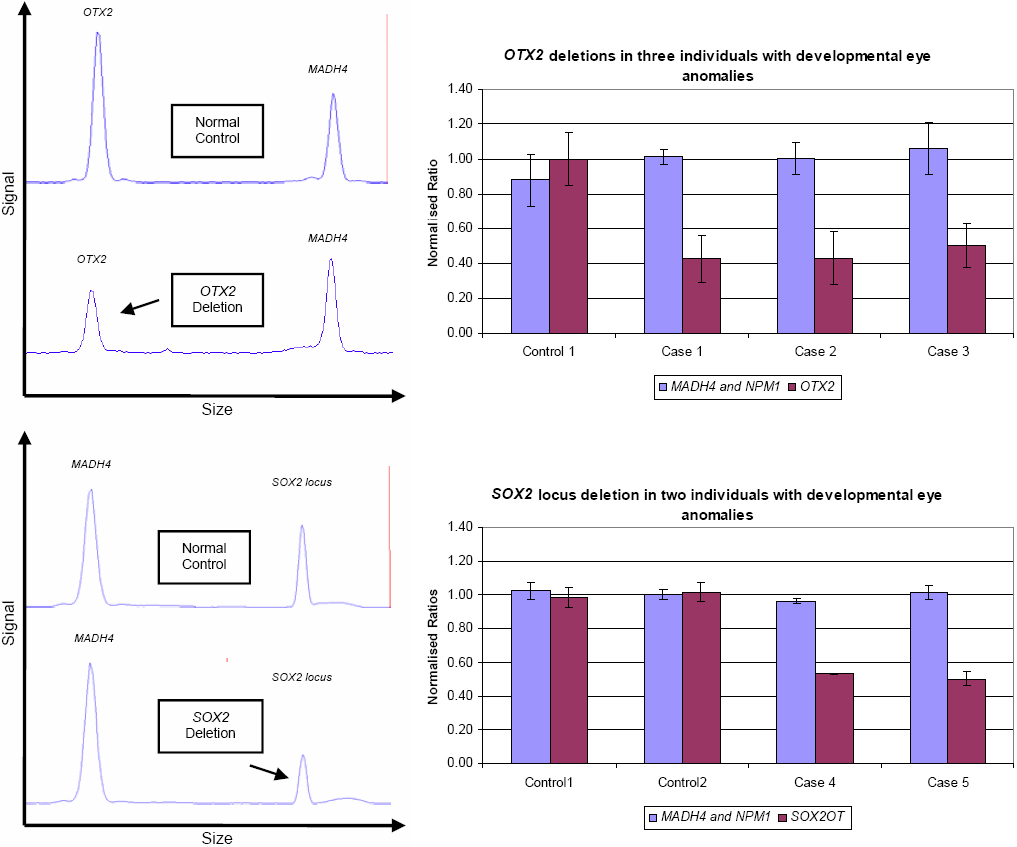
 Figure 1 of
Wyatt, Mol Vis 2009; 15:1445-1448.
Figure 1 of
Wyatt, Mol Vis 2009; 15:1445-1448.