Figure 8. Comparison of chaperone activities of α-, αB-crystallin, K174/175A, and K174/175E. A: Comparison of chaperone activities under heat stress at 65 °C using porcine γ-crystallin as a substrate and in a molar ratio
(chaperone/γ-crystallin) of 1:2.9. The final concentration of porcine γ-crystallin is 8.3 μM. B: Comparison of chaperone activities under heat stress at 70 °C using rabbit muscle aldolase as a substrate and in a molar
ratio (chaperone/aldolase) of 1:1.7. The final concentration of porcine aldolase is 2.1 μM. The light-scattering (turbidity)
curves at 360 nm in the presence of chaperoning crystallins are shown as follows: control solution without chaperone (open
square), α-crystallin (open circle), αB-crystallin (open triangle), K174/175A (open asterisk), and K174/175E (closed square).
It is noted that the chaperone activity of K174/175A can only be distinguished from that of α-crystallin and K174/175E using
aldolase instead of γ-crystallin as a substrate in the chaperone assays under heat stress.
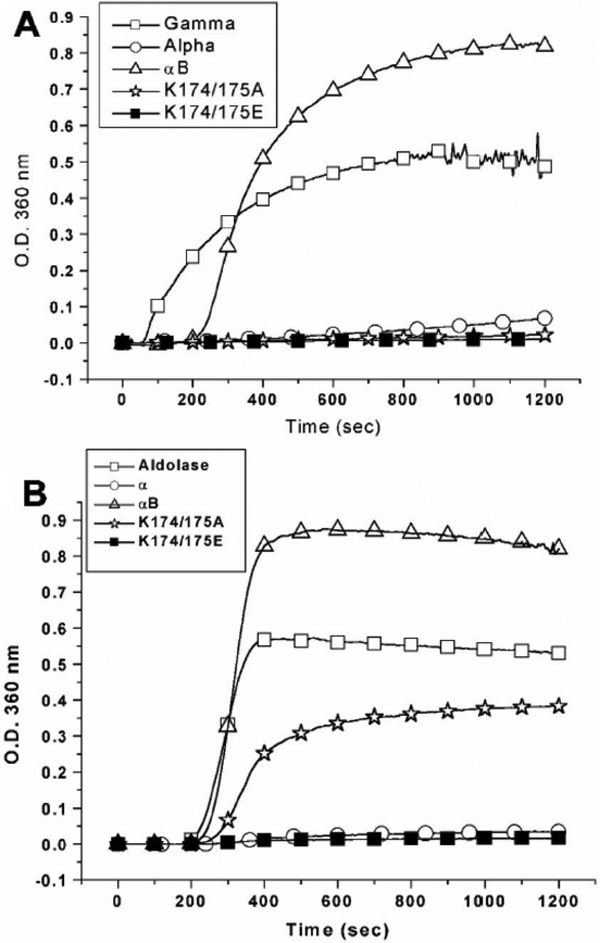
 Figure 8 of
Liao, Mol Vis 2009; 15:1429-1444.
Figure 8 of
Liao, Mol Vis 2009; 15:1429-1444.