Figure 3. Multipoint variance-components
linkage LOD scores for OOA (left) and ASHK (right) for two different
SNP densities. ALL SNPs analyses used all markers that passed quality
control measures (1,236 for OOA and 1,227 for ASHK); 198 SNPs analyses
used a subset of 198 markers spaced at least 100 Kb apart (mean
inter-marker distance = 133 Kb). Locations of linkage peaks using ALL
SNPs are indicated by vertical lines.
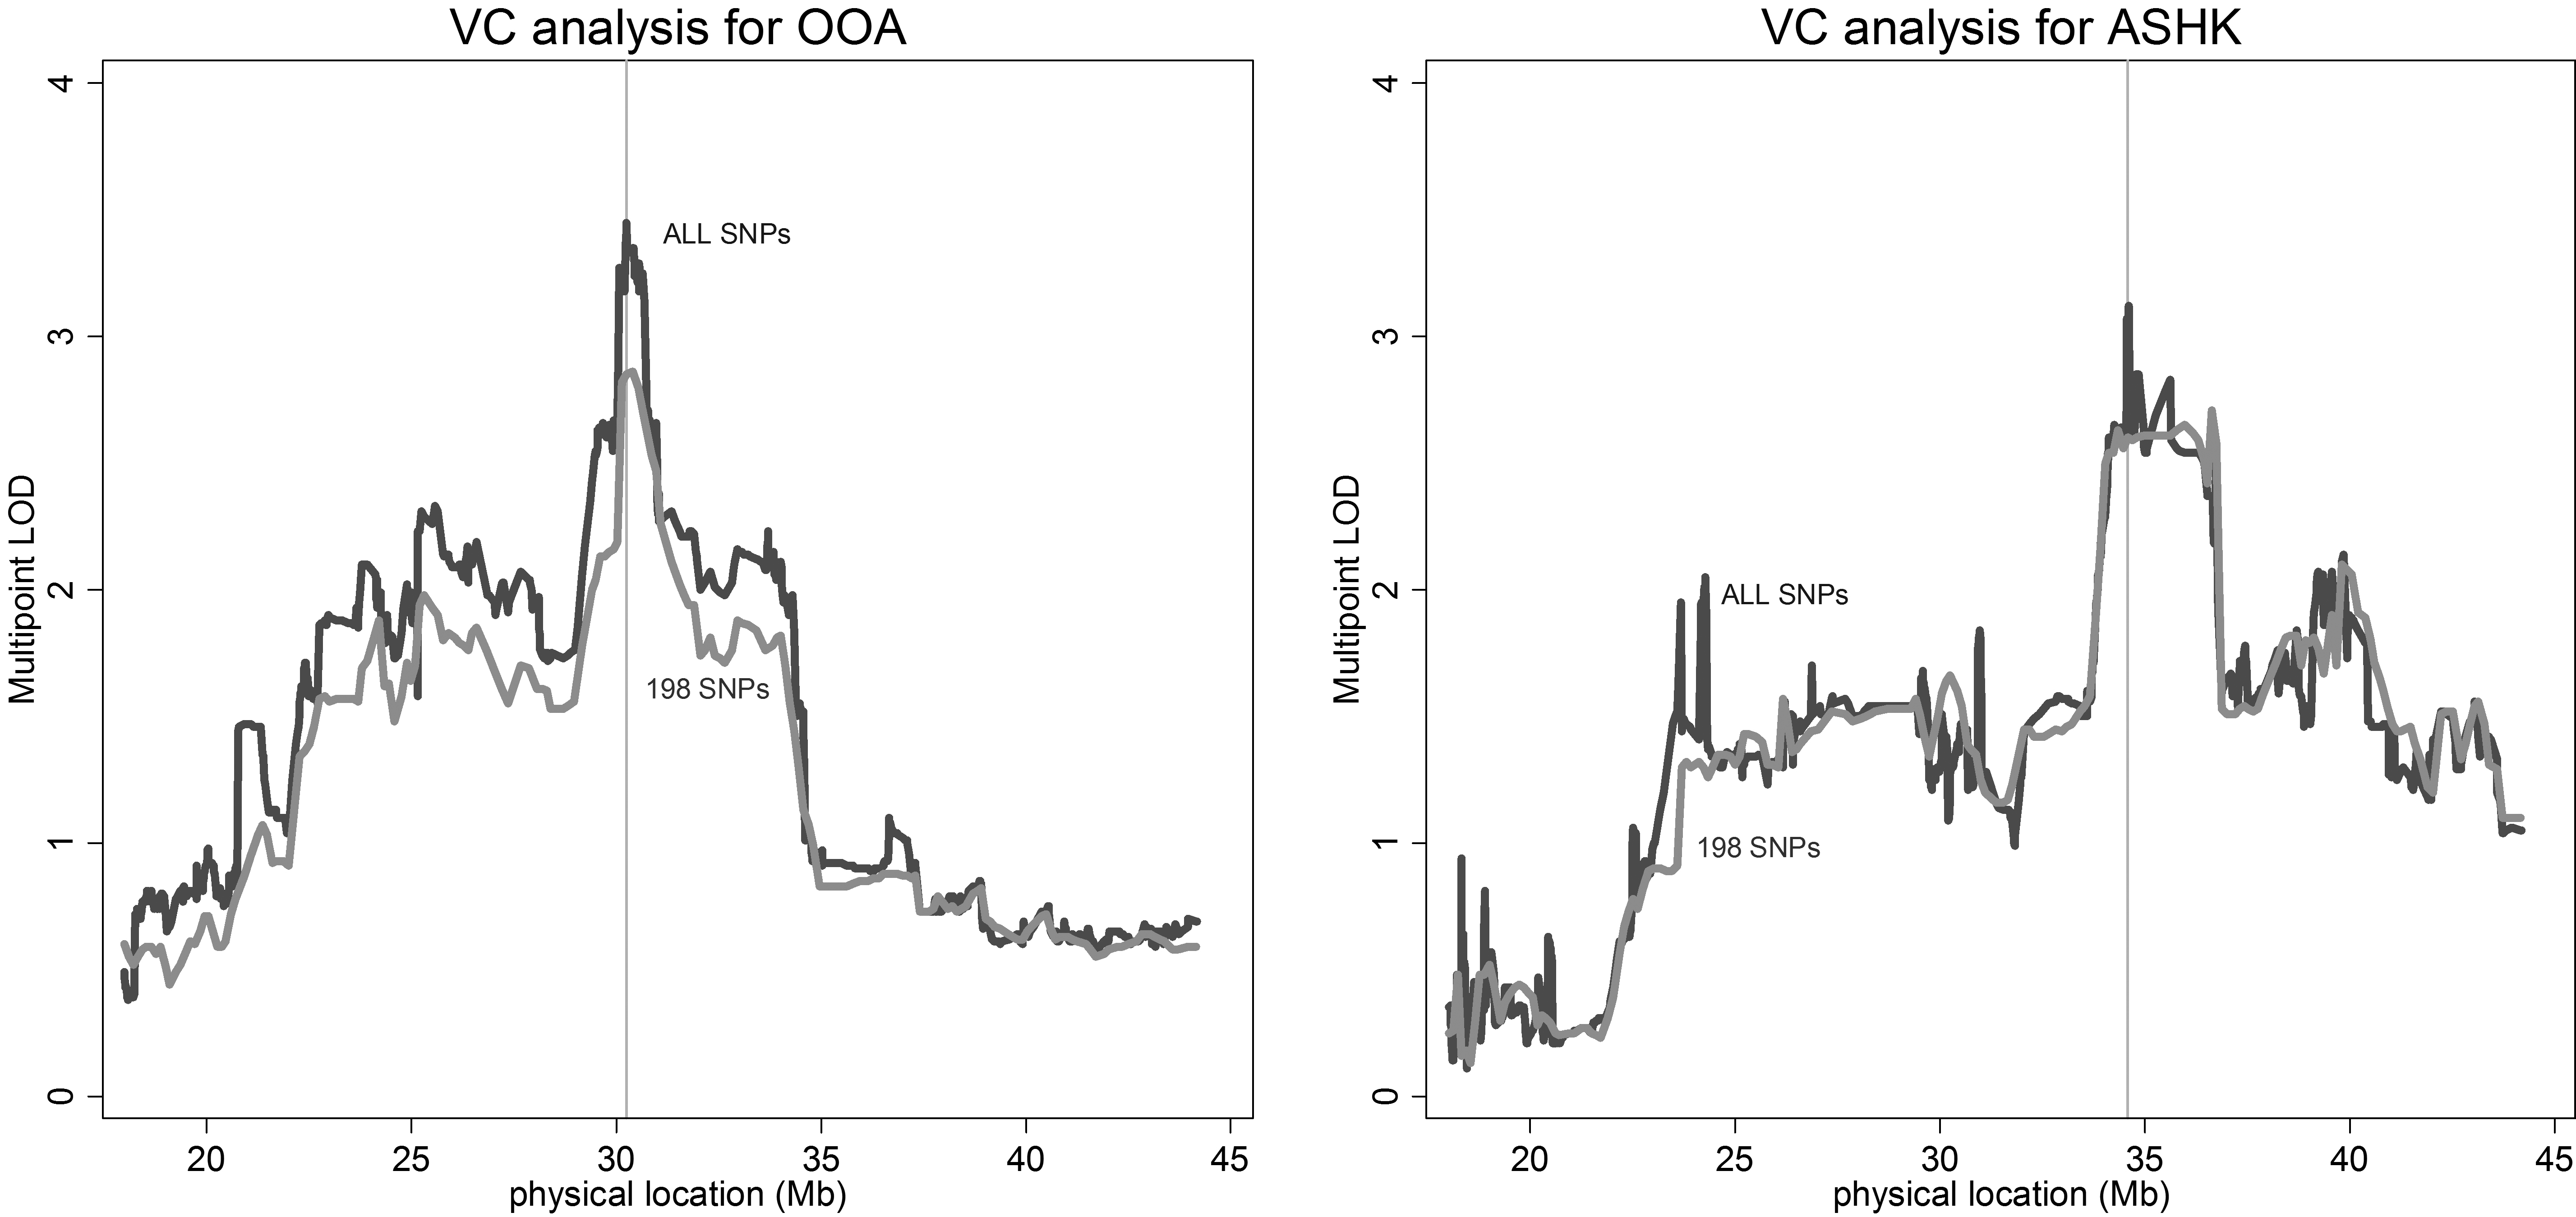
 Figure 3 of Wojciechowski, Mol Vis 2009; 15:1398-1406.