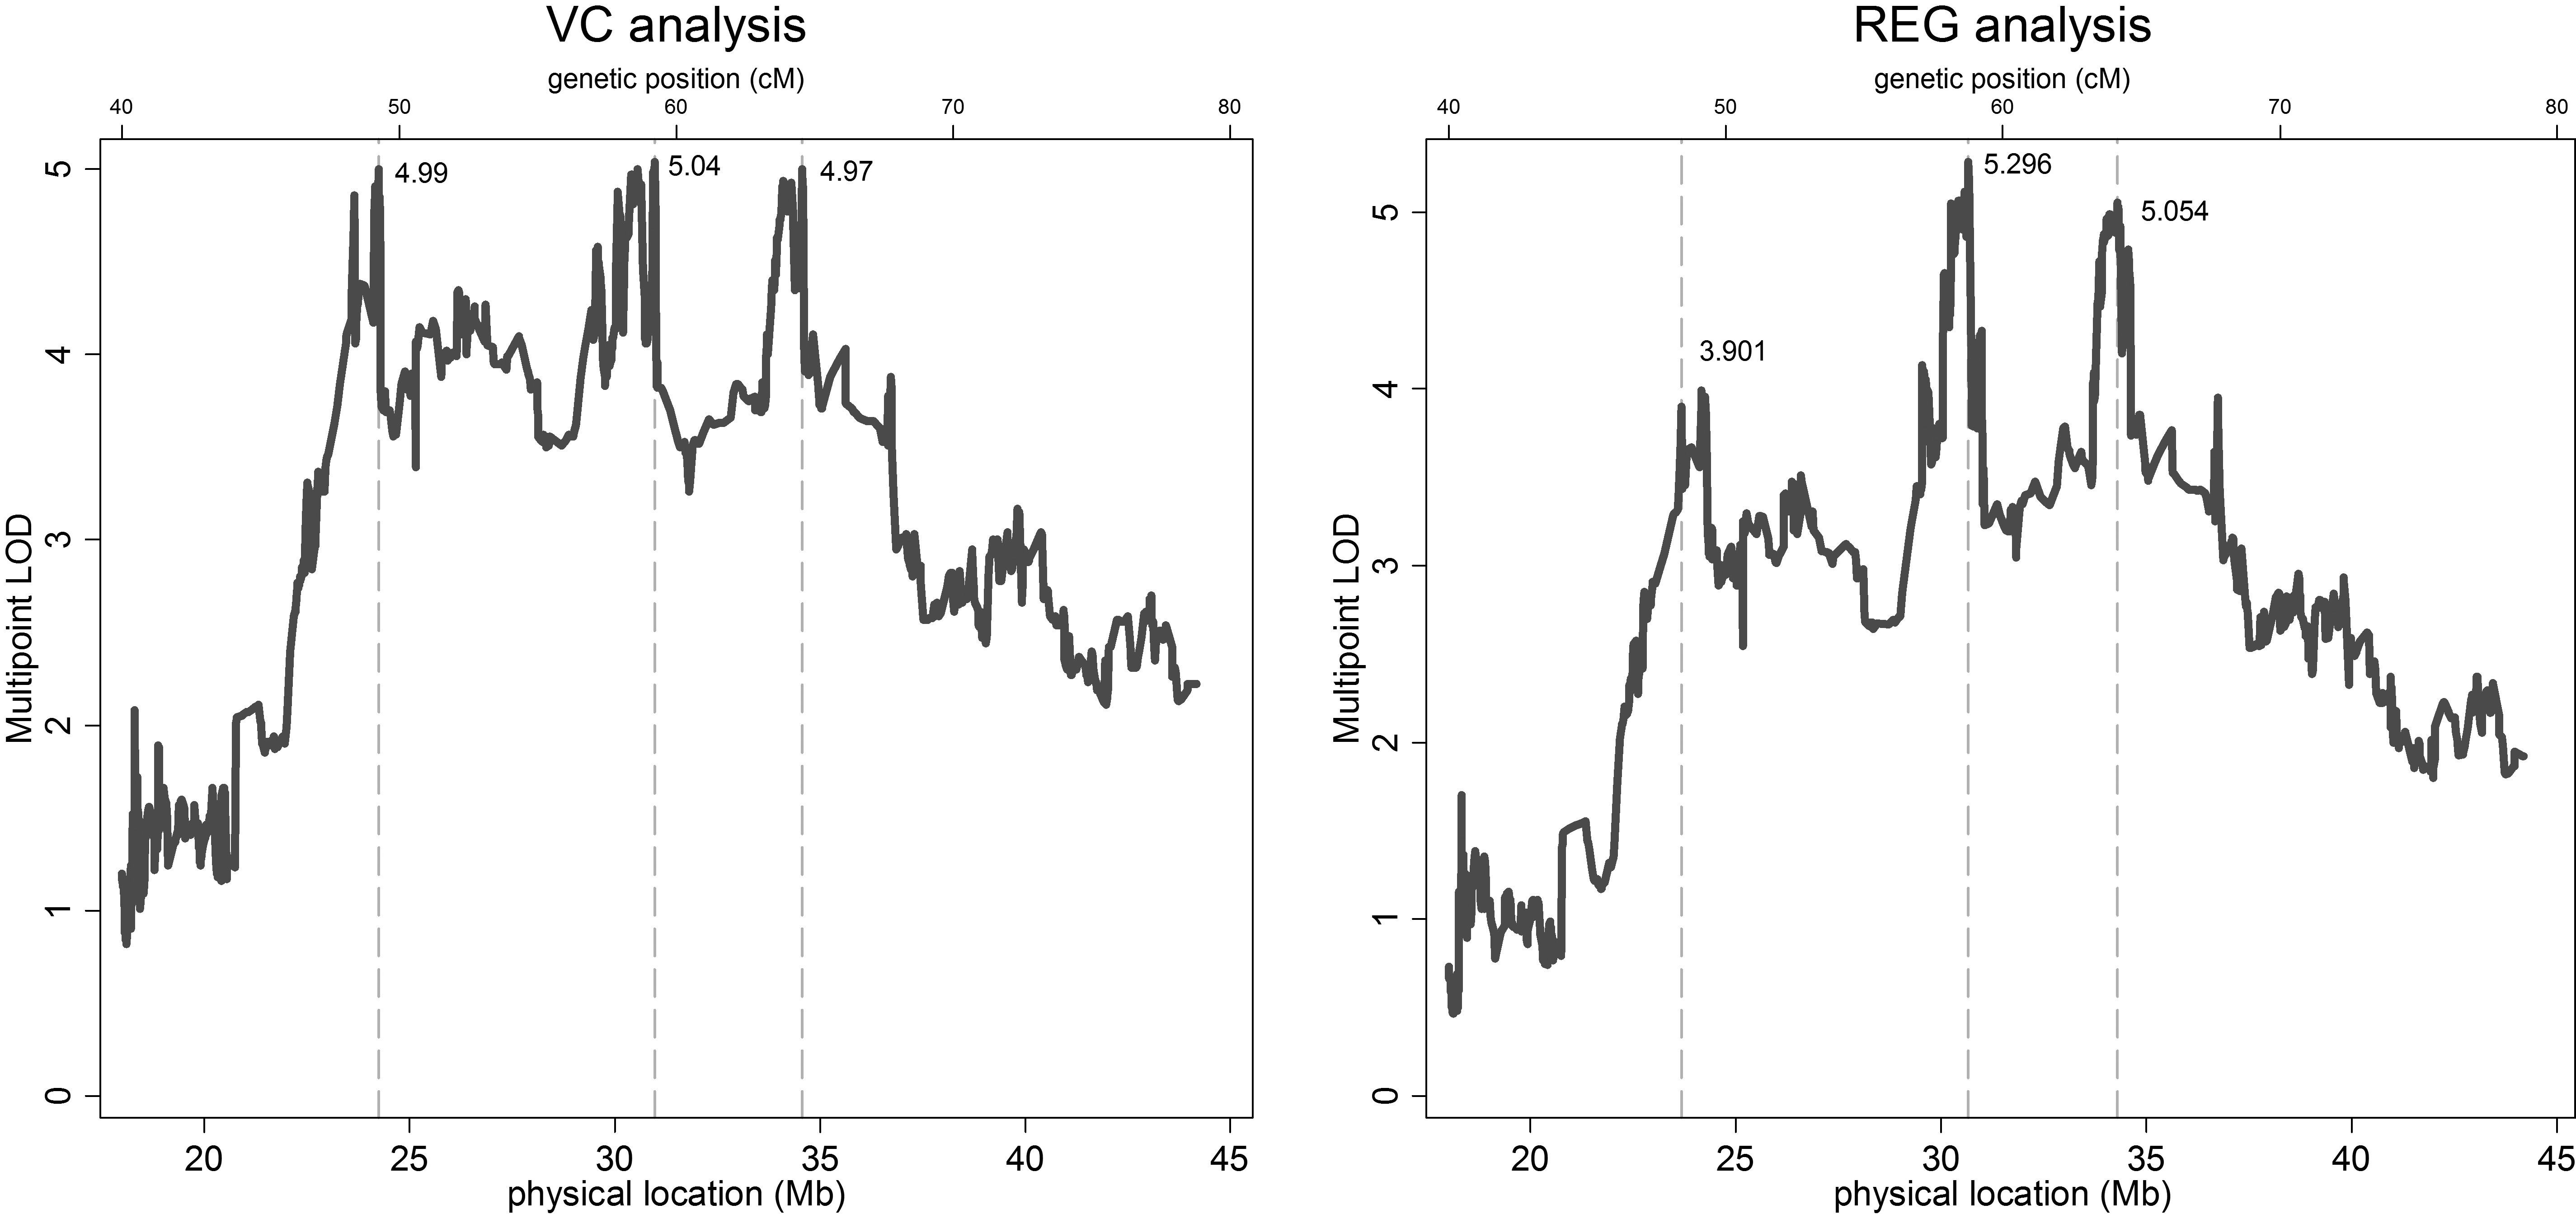
Figure 2. Multipoint variance-components
(left) and
MERLIN-REGRESS
(right) LOD scores for a combined analysis of OOA and ASHK families.
Locations of local linkage peaks are indicated by vertical lines.
Physical locations of SNP markers (bottom axis, in Mb) were determined
using the NCBI dbSNP reference map, build 123. Genetic map positions
(top axis, in cM) were obtained through the Rutgers Combined
Linkage-Physical Map of the Human Genome. Because the relationship
between physical position and genetic maps are non-linear, genetic
positions in the figure are approximate.
 Figure 2 of Wojciechowski, Mol Vis 2009; 15:1398-1406.