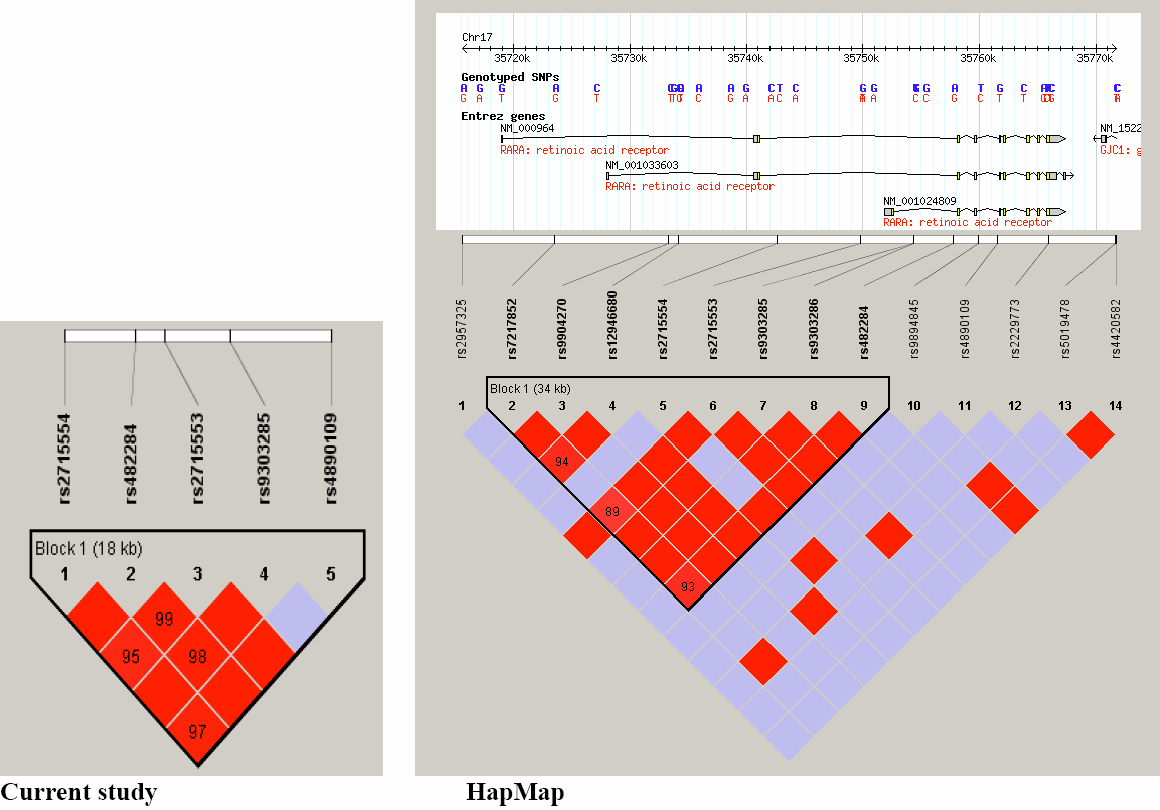
Figure 2. Linkage disequilibrium (LD) map comparing the current study with HapMap data for single nucleotide polymorphisms in the
RARA gene. In the left hand panel is shown the LD block with r
2 values indicated in the red diamonds and the position of the 5 tag SNPs for the current study. In the right hand panel the
LD map from available HapMap data with position of available SNPs as well as the 5 tag SNPs (r
2 values are indicated in the diamonds). At the top of the panel are shown the different
RARA alternatively spliced transcripts at this location on chromosome 17 (
http://genome.ucsc.edu/).
 Figure 2 of
Veerappan, Mol Vis 2009; 15:1390-1397.
Figure 2 of
Veerappan, Mol Vis 2009; 15:1390-1397.