Figure 3. Expression of ICAM-1 on various
subsets of retinal cells. Single-cell suspensions were stained with
isotype control or with anti-ICAM-1 mAb. Cells were coincubated with
antibodies that detect cell surface expression of CD11b, CD31, CD105,
or Thy-1 (A), or cells were permeabilized followed by incubation
with antibodies against rhodopsin and vimentin (B) or GFAP (C)
to detect intracellular expression of these markers. PE-conjugated
anti-ICAM-1 mAb was used in all conditions except when staining GFAP+
cells, where FITC-conjugated mAb was used instead. The average
expression of ICAM-1 (cMFI) on gated CD11b+, CD31+,
CD105+, Thy-1+, GFAP+, rhodopsin+,
and vimentin+ events were calculated as described in
Methods. Data are shown as the mean±SEM from three to four independent
experiments. D: Representative dot plots of ICAM-1 versus
various markers are shown. Red dots represent cells that expressed
these markers. Horizontal and vertical lines represent gates obtained
with isotype control antibodies.
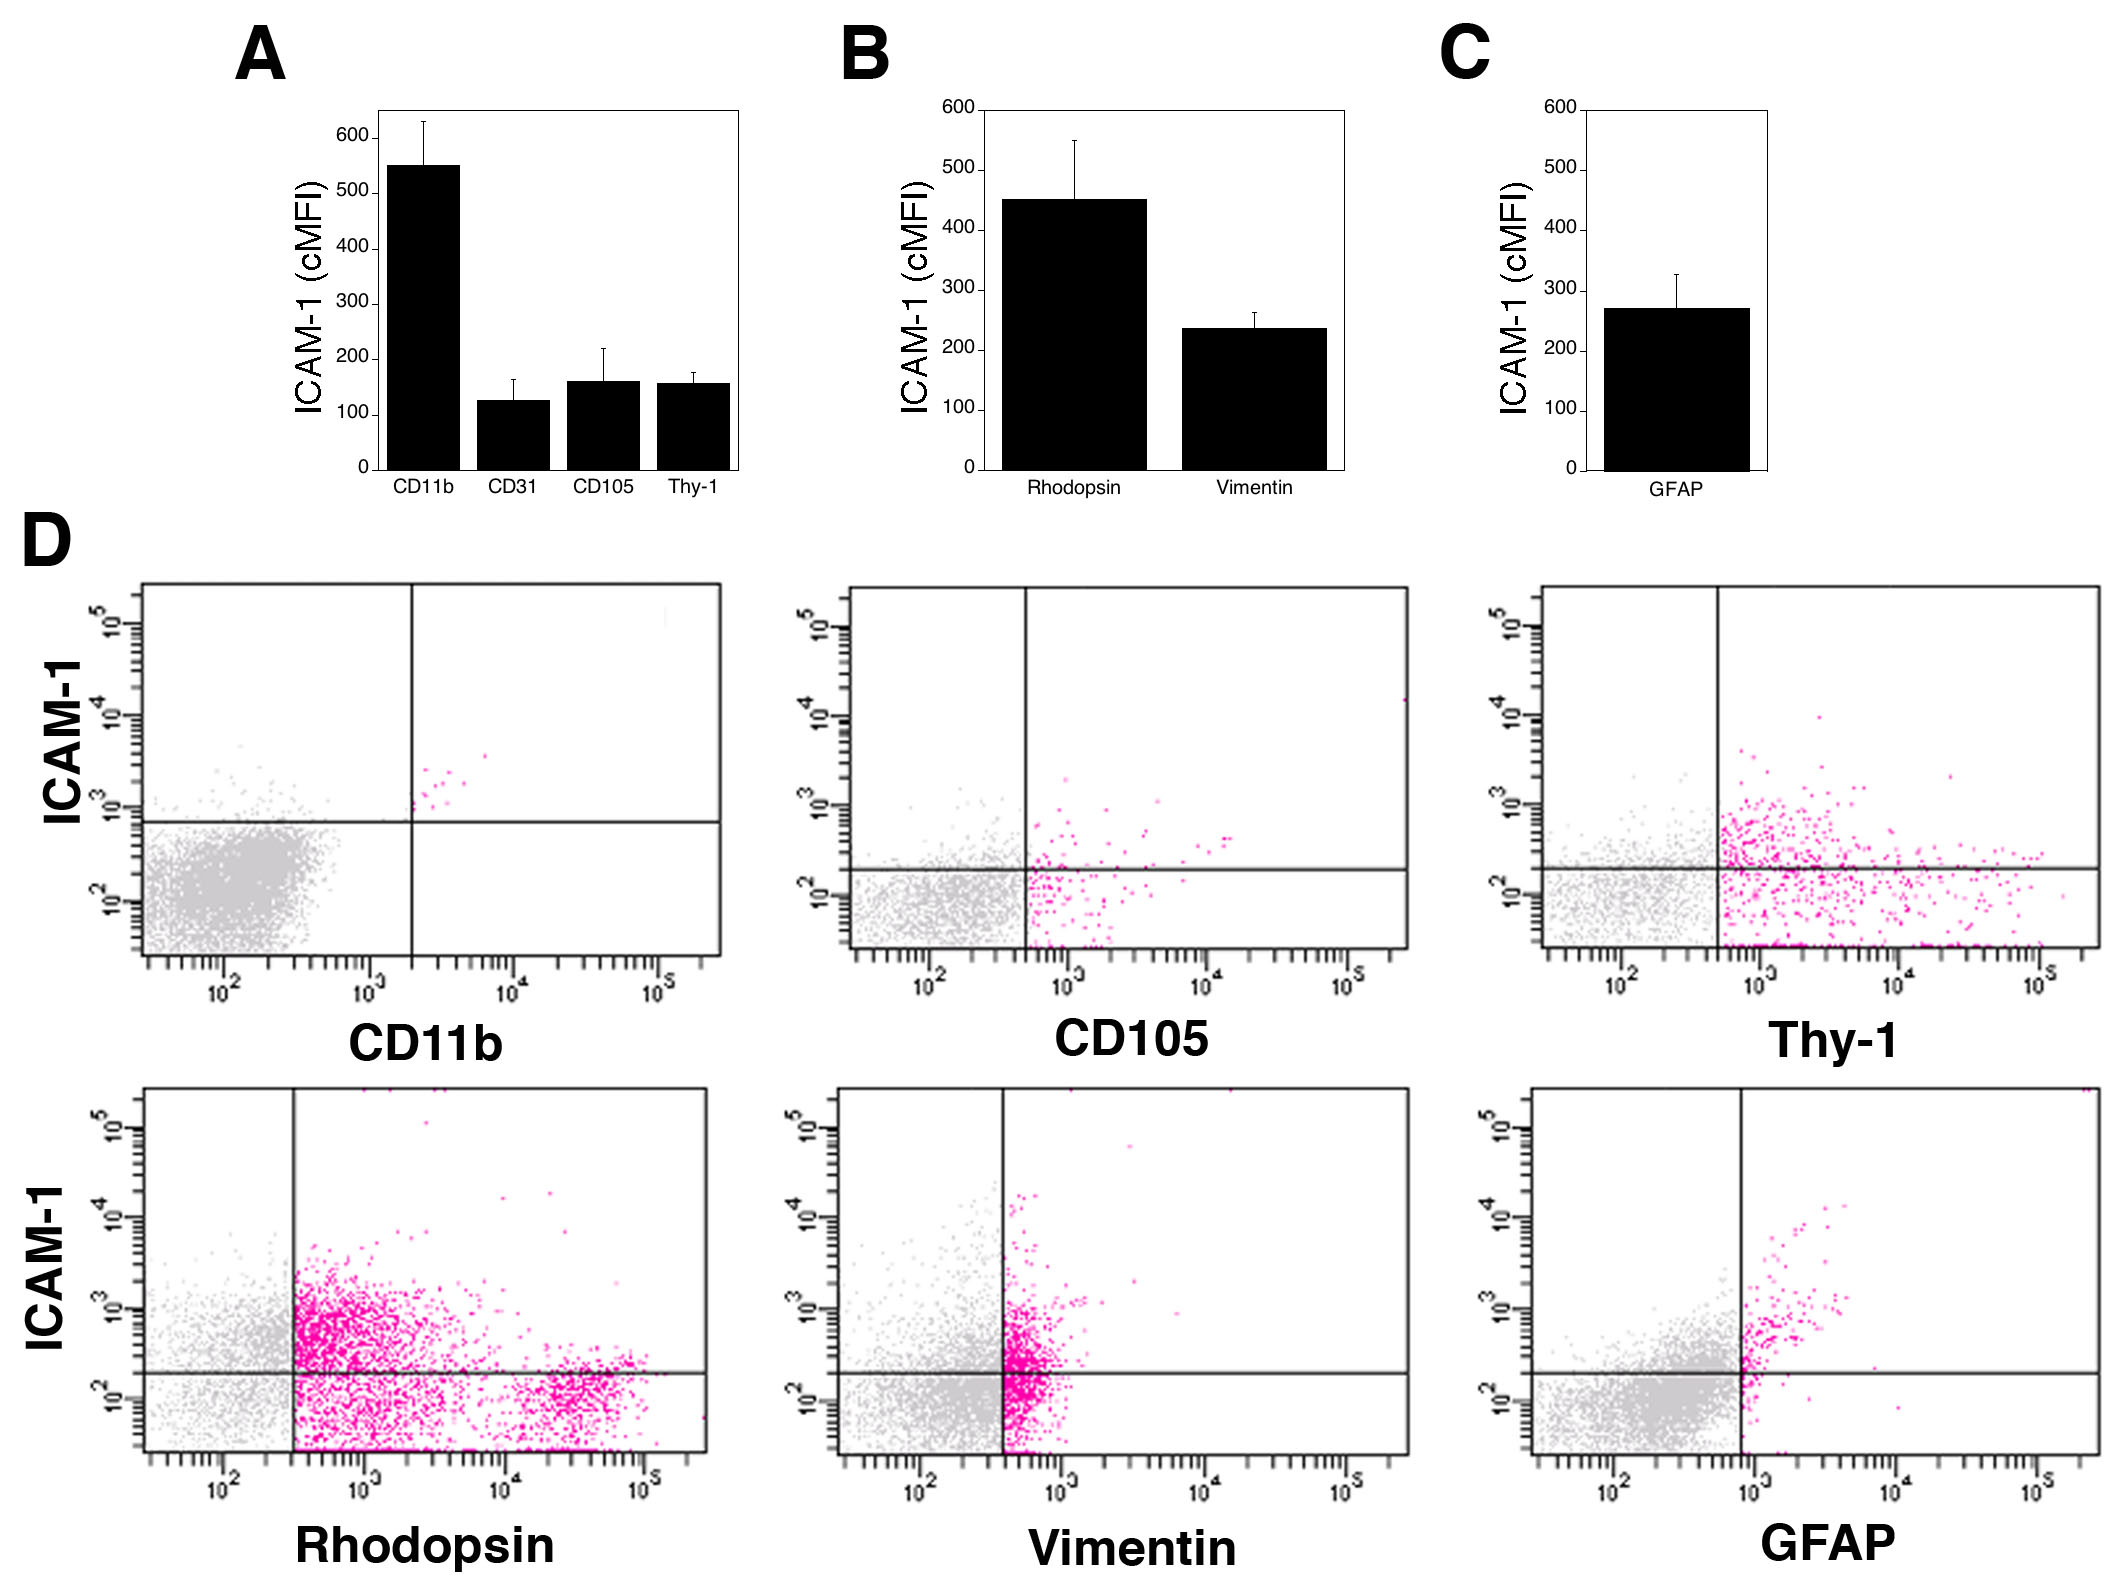
 Figure 3 of Portillo, Mol Vis 2009; 15:1383-1389.