Figure 2 of
Portillo, Mol Vis 2009; 15:1383-1389.
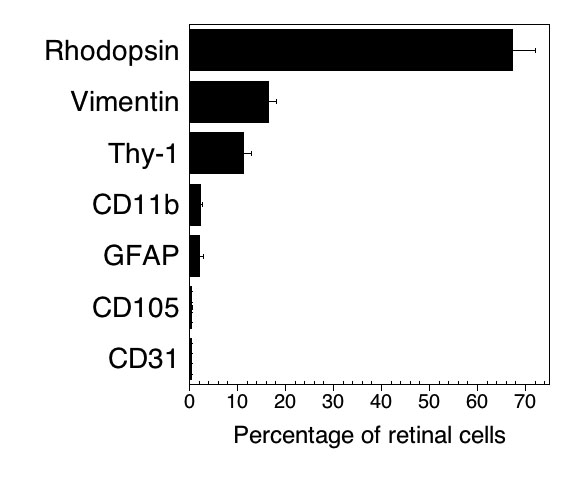
Figure 2.
Phenotypic composition of retinal cell suspensions. Single-cell suspensions were stained with the indicated antibodies. Data are shown as the mean±SEM from six to nine independent experiments.
 Figure 2 of
Portillo, Mol Vis 2009; 15:1383-1389.
Figure 2 of
Portillo, Mol Vis 2009; 15:1383-1389.