Figure 1. Flow cytometric analysis of
retinal cell suspensions. A: Single-cell suspensions obtained
after enzymatic digestion of retinas were permeabilized and stained
with antibodies against rhodopsin and vimentin (thick lines) or isotype
control antibodies (shaded areas) as described in Methods. The gate R2
in histograms reveal events that stained with either anti-rhodopsin or
anti-vimentin antibodies. B: The forward scatter (FSC) versus
side scatter (SSC) profile of retinal cells is shown. Red dots
represent vimentin+ or rhodopsin+ events as
defined by gating criteria (R2) shown in panel A. C:
Single-cell suspensions were stained with antibodies against CD11b,
CD31, and Thy-1 to detect surface expression of these molecules.
Permeabilized cells were incubated with anti-GFAP antibody. Red dots
represent events that stained with either CD11b or Thy-1 as indicated.
Due to low frequency of CD31+ and GFAP+ events,
cells that did not stain with anti-CD31 and anti-GFAP antibodies were
removed from the dot plots, thus enabling easier identification of CD31+
and GFAP+ events. Results are representative of six to nine
independent experiments.
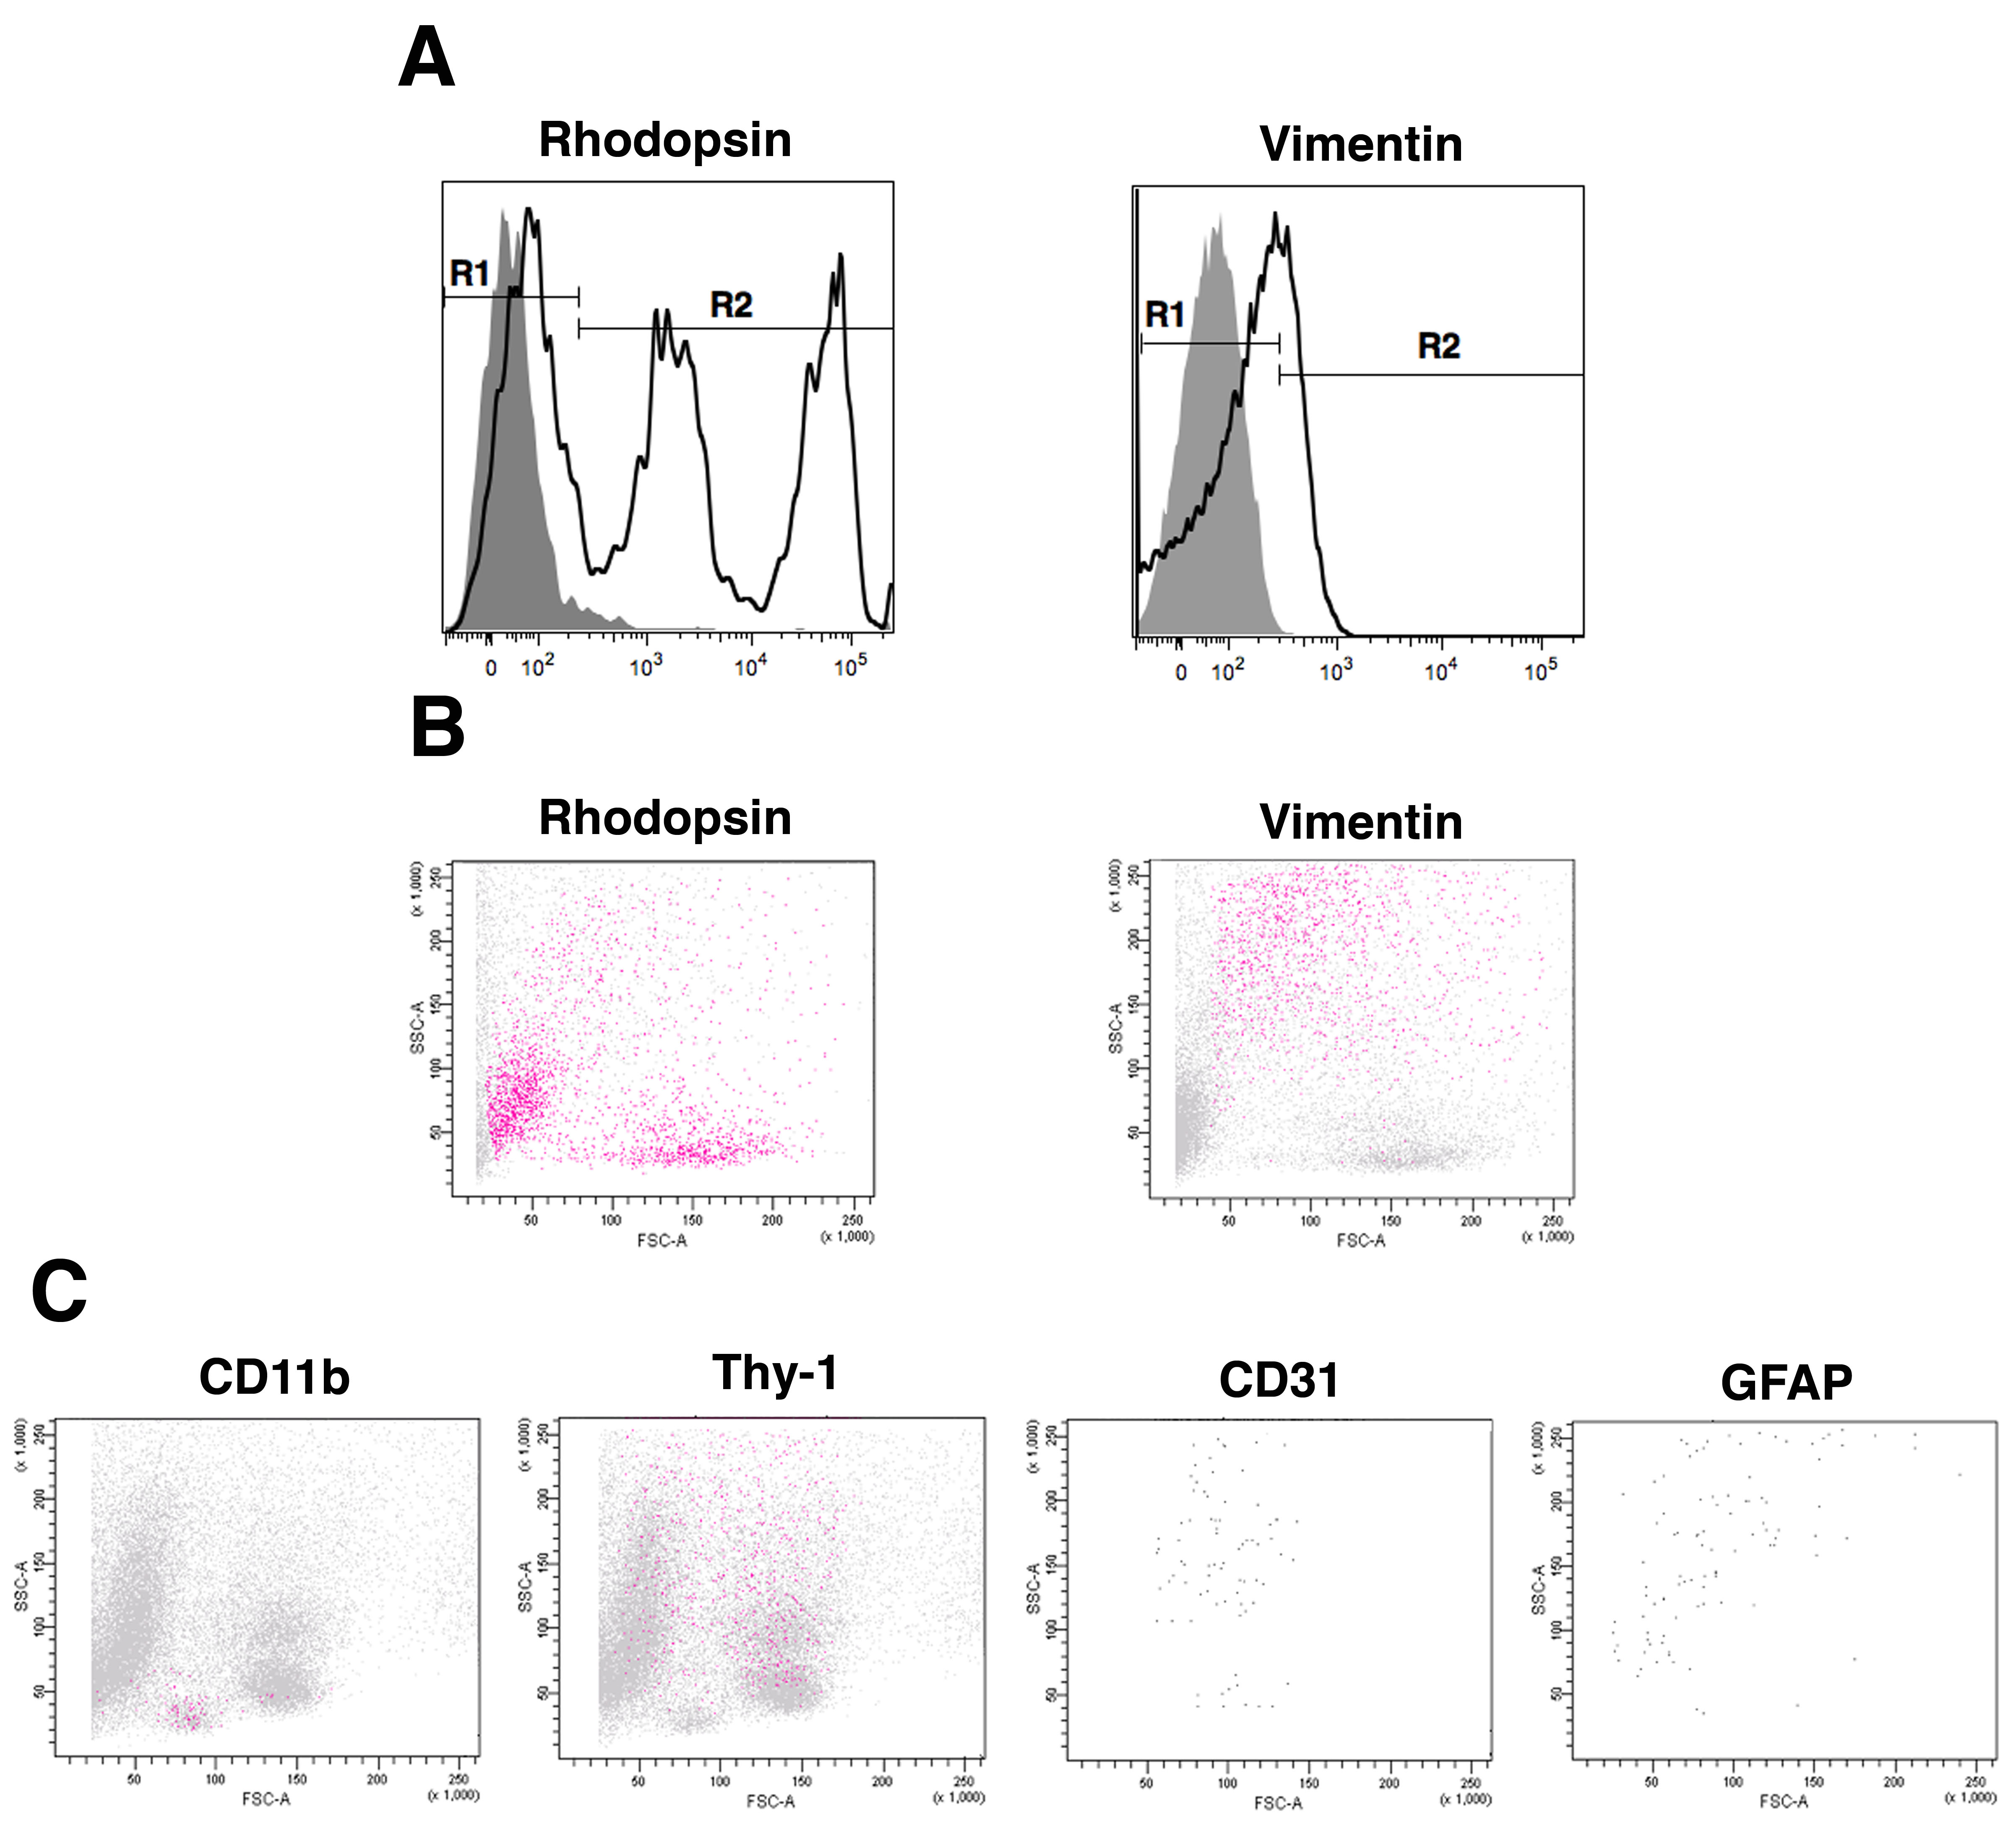
 Figure 1 of Portillo, Mol Vis 2009; 15:1383-1389.