Figure 6. Light-adapted ERG b-wave responses-intensity curves in C57BL/6J mice. In all the animals, one eye was injected subretinally while the contralateral eye was not treated. A, B show HEPES-treated mice and C, D show AAV-9.RSV.AP-injected mice. The left column shows the 3-month-old groups (n=5 for each group), and the right column
shows the 12-month-old groups (n=5 for each group). The filled symbols represent the injected eyes, and the open symbols represent
the untreated eyes. Background light was 30 cd/m2. Error bars indicate the standard deviation from the mean (mean±SD).
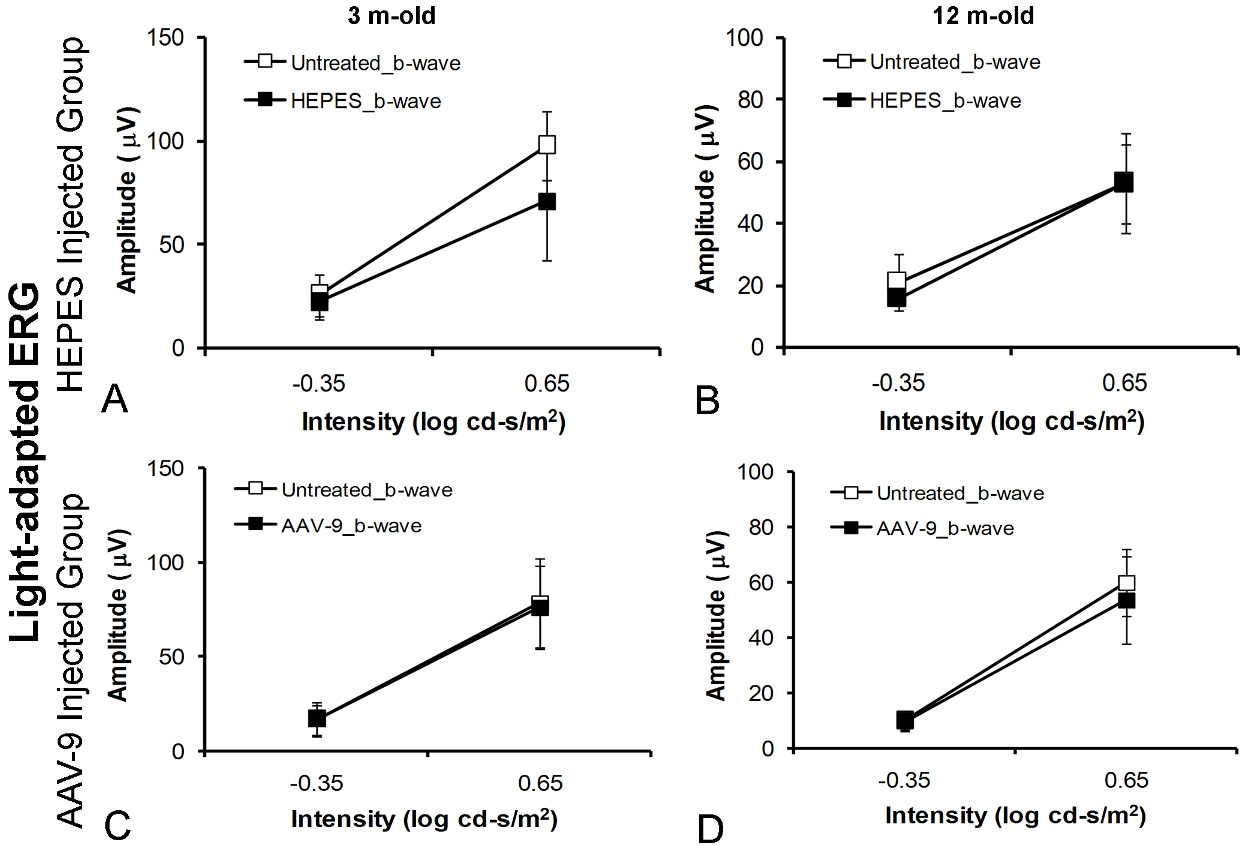
 Figure 6 of
Lei, Mol Vis 2009; 15:1374-1382.
Figure 6 of
Lei, Mol Vis 2009; 15:1374-1382.