Figure 7. Three-dimensional protein structure. The electrostatic potentials are shown in red (negative potential) and green (positive
potential) clouds. The alteration from a positive in the wild-type (A) to a negative potential in the mutant form (B) is indicated by the white arrows. Protein models of wild-type αB-crystallin (C) and its mutant form (D) are displayed. The antiparallel β sheets are yellow and the α helices are red. The blue sections are the looping regions.
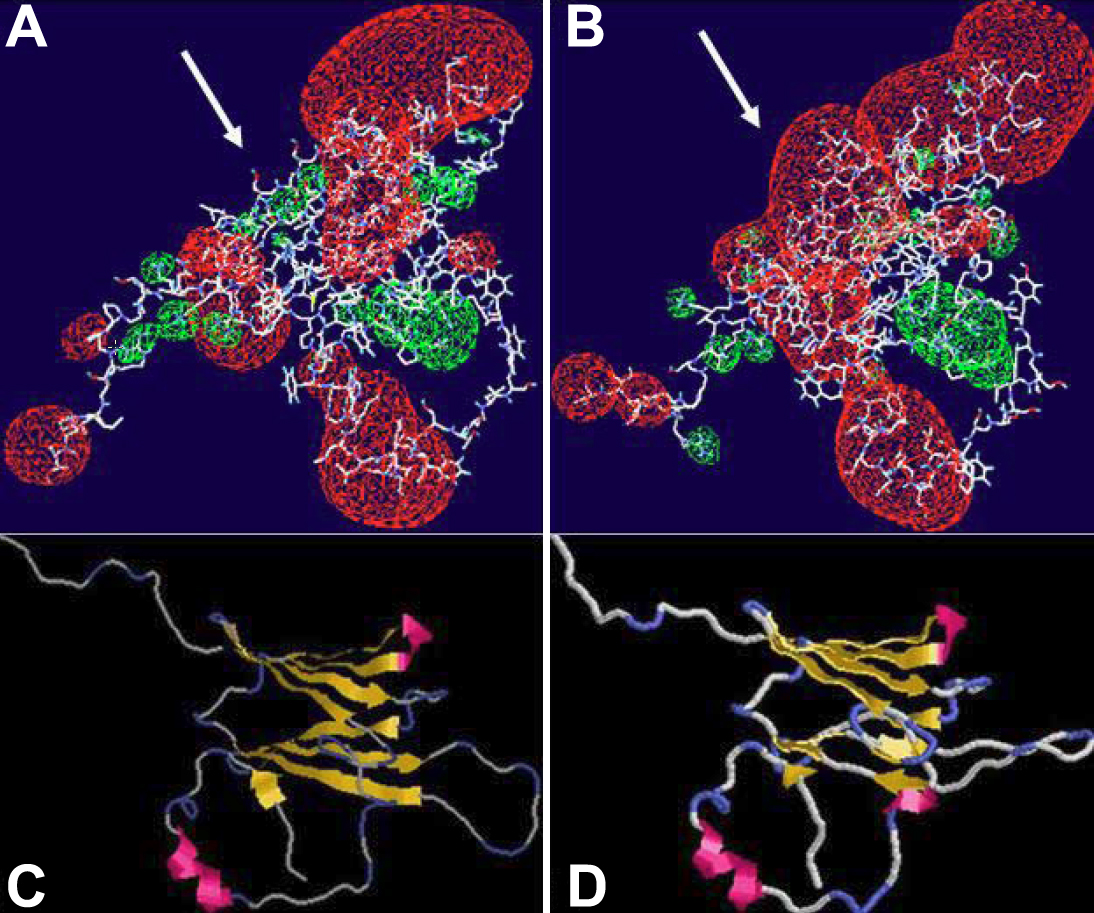
 Figure 7 of
Chen, Mol Vis 2009; 15:1359-1365.
Figure 7 of
Chen, Mol Vis 2009; 15:1359-1365.