Figure 6. Hydropathy plot of wild-type and mutated αB-crystallin. The x-axis represents the position of amino acids. The y-axis represents
the hydropathy value in a default window size of 7. It was obvious that the mutant form showed lower hydrophilicity in the
corresponding region compared with the wild-type form (indicated by white arrows).
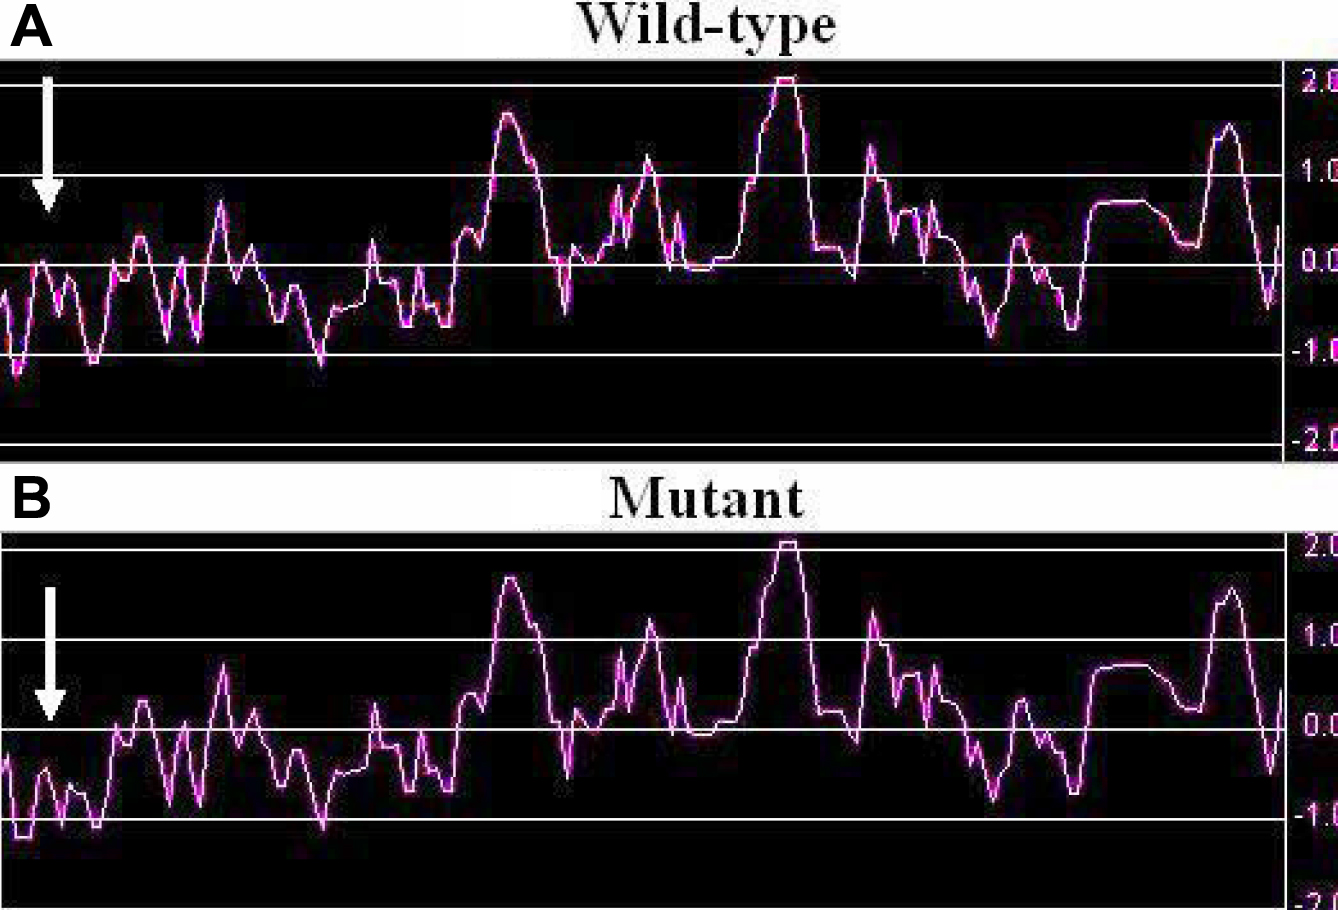
 Figure 6 of
Chen, Mol Vis 2009; 15:1359-1365.
Figure 6 of
Chen, Mol Vis 2009; 15:1359-1365.