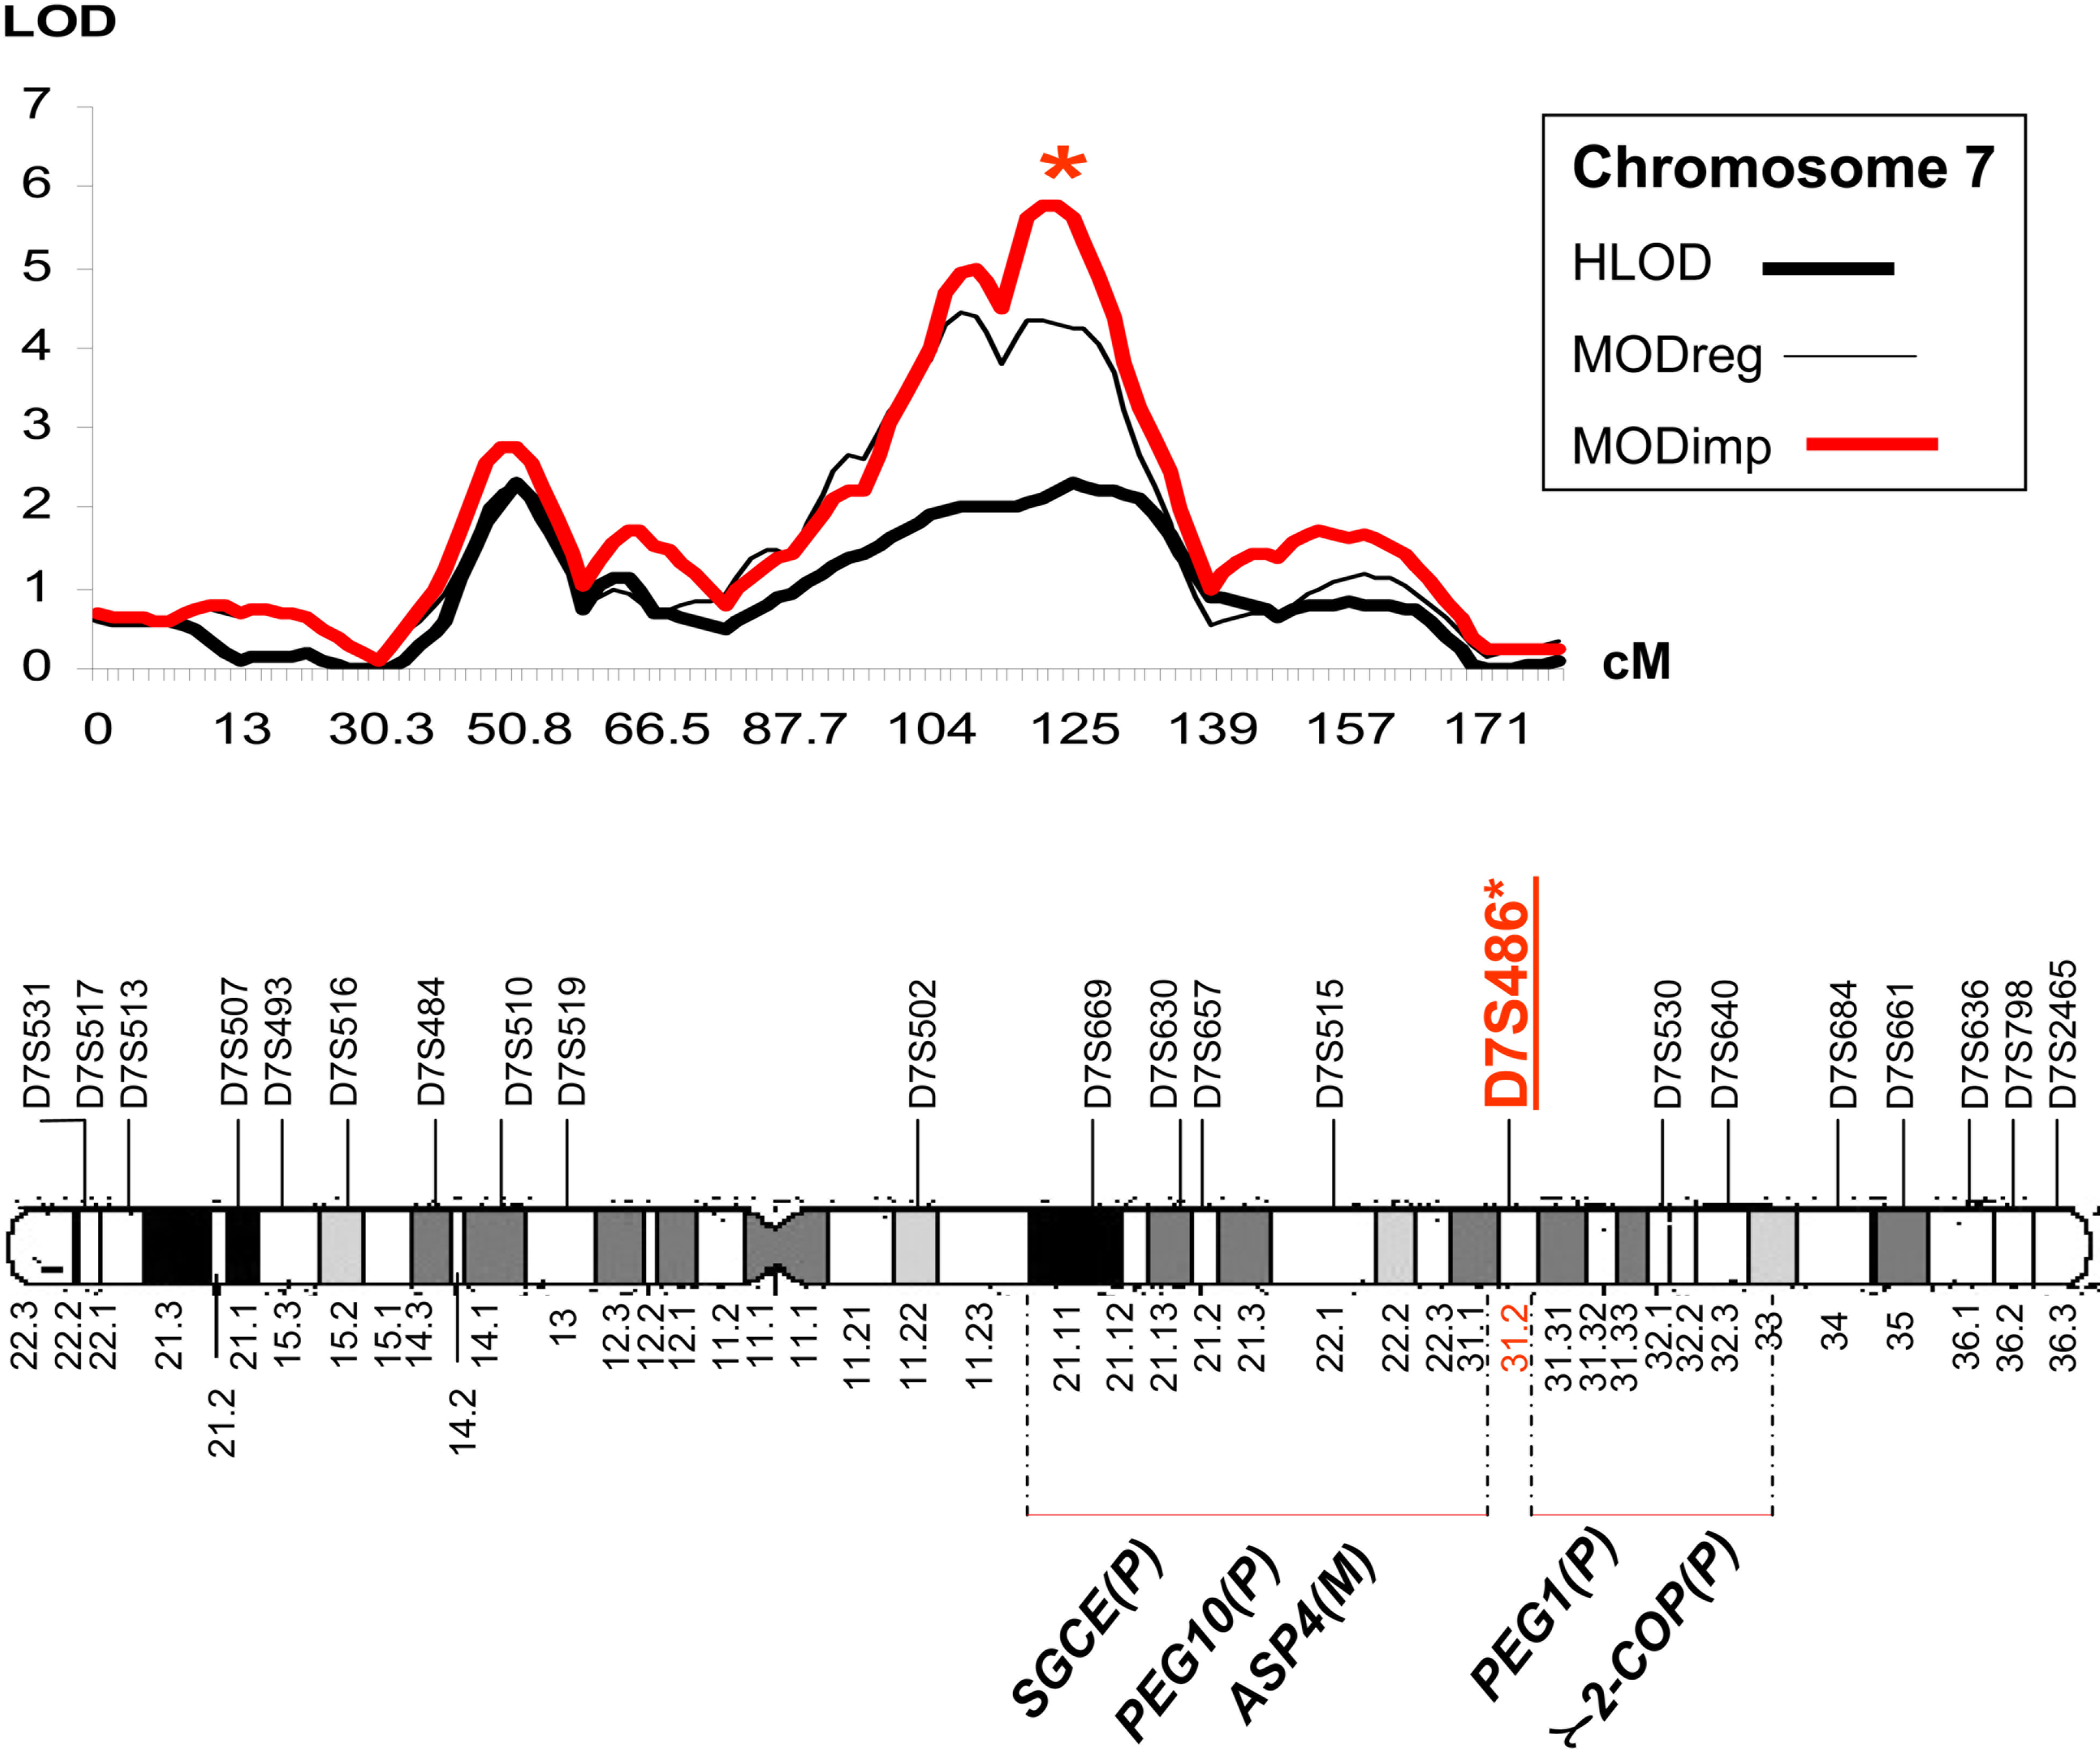
Figure 2. HLOD and MOD scores for
chromosome 7. Above: Solid thick black lines=Heterogeneity logarithm of
the odds (HLOD); solid thin black lines=MOD scores for the
non-imprinting model “MOD
reg” and solid thick red
lines=MOD scores for the imprinting model “MOD
imp”. HLOD
scores are calculated under a recessive model with disease allele
frequency P
m=0.01, penetrance=0.8 and a phenocopy rate for
the non-gene carriers=0.01 [
7].
Below: A schematic representation of chromosome 7 (MOD
imp=5.78)
was obtained at 7q31.2 between two blocks of imprinted genes [
34,
35].
(P)=paternally
imprinted gene, (M)=maternally imprinted gene.
 Figure 2 of Shaaban, Mol Vis 2009; 15:1351-1358.