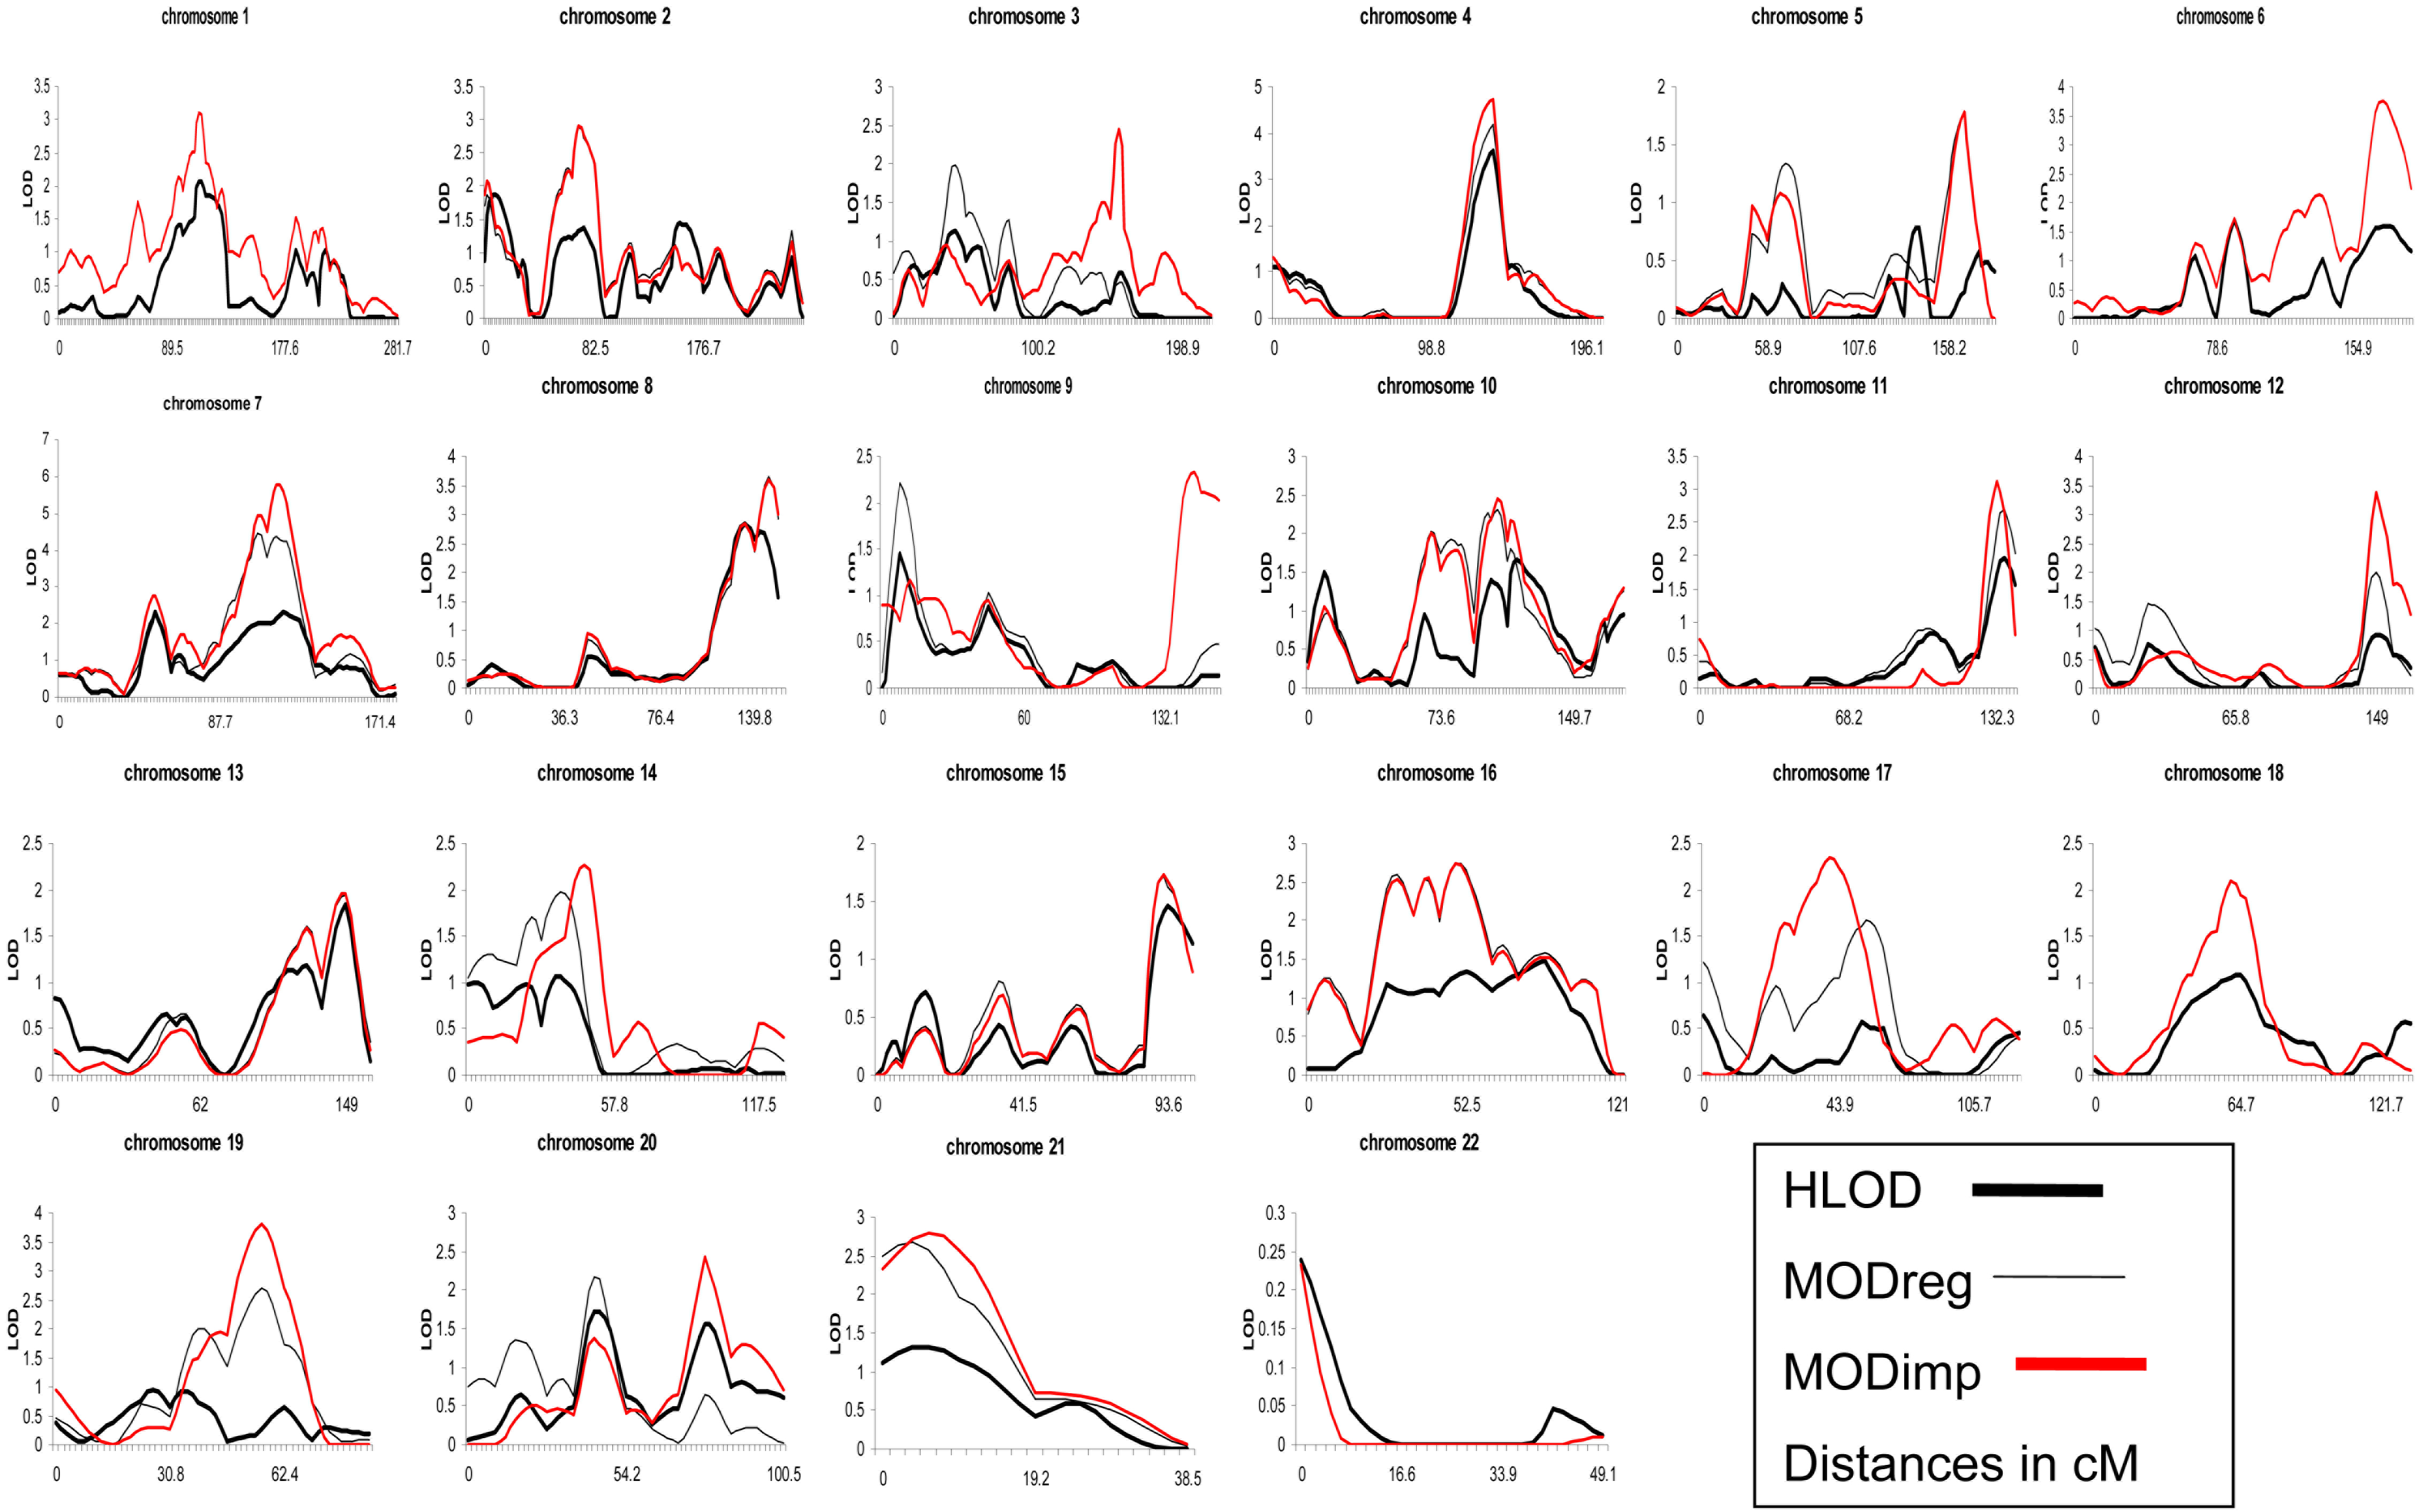
Figure 1. HLOD and MOD scores for the 22
autosomal chromosomes. Parametric genome-wide linkage analysis results
of the autosomal chromosomes in 55 Japanese families with comitant
strabismus. Solid thick black lines=Heterogeneity logarithm of
the odds “HLOD”; solid thin black lines=MOD scores for the
non-imprinting model “MODreg”, and solid thick red lines=MOD scores for
the imprinting model “MODimp”. For each chromosome, the HLOD scores
displayed are reported for either the dominant or the recessive model
(whichever shows the overall highest score) with the assumption of
disease allele frequency (P
m) being 0.01, penetrance being
0.8, and a phenocopy rate for the non-gene carriers being 0.01 [
7].
MOD
imp
and MOD
reg curves for chromosomes 1, 6, 18, and 22 are
identical.
 Figure 1 of Shaaban, Mol Vis 2009; 15:1351-1358.