Figure 6. Correlation between fold change values obtained by microarray analysis and qRT–PCR for 16 selected transcripts. Fold change
(FC) values obtained by microarray analysis were significantly correlated to those obtained by qRT–PCR (Spearman rank test;
r=0.89, p<0.0001, n=16).
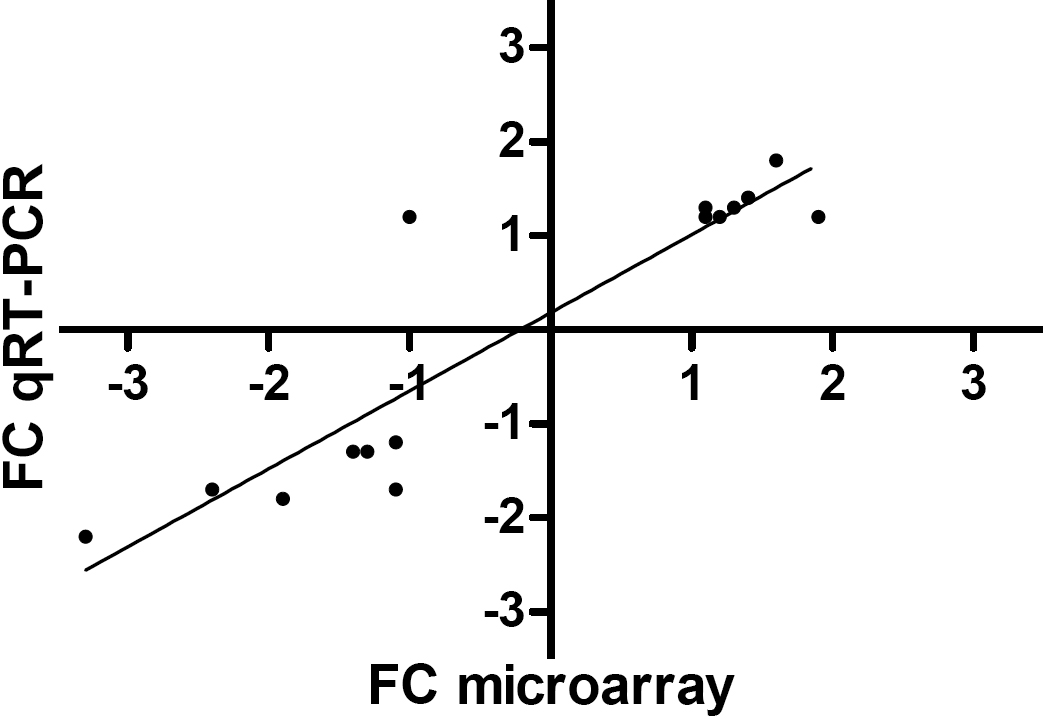
 Figure 6 of
Tröße, Mol Vis 2009; 15:1332-1350.
Figure 6 of
Tröße, Mol Vis 2009; 15:1332-1350.