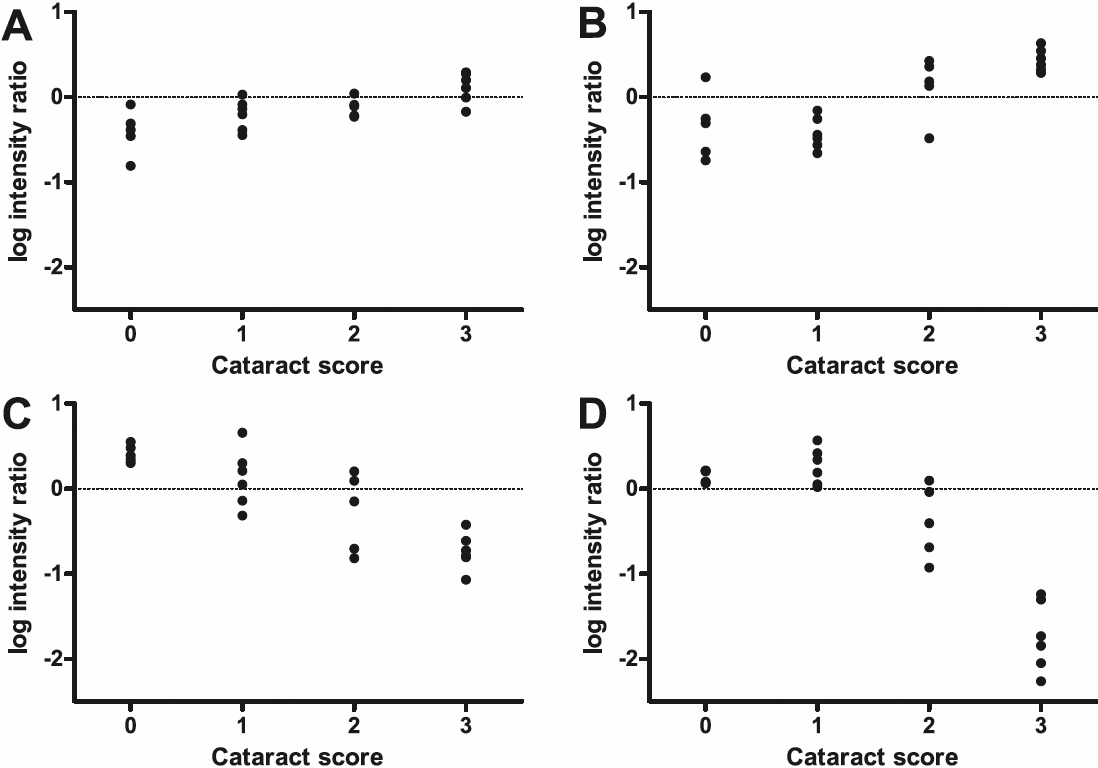
Figure 5. Examples of transcripts with
different expression patterns related to cataract score. For four
selected significantly differentially expressed transcripts, the log
intensity ratios are plotted against the cataract score of the
respective sample, not taking into account which dietary group the
samples belong to. For a certain transcript, if the difference between
the mean log intensity ratios of the lenses with a score of 0 and the
lenses with a score of 1 was 0.2 or greater, this transcript was
classified as “early” regulated. If this difference was less than 0.2,
the transcript was classified as “late” regulated.
A: SPARC
precursor (SPARC;
CA052160)
was chosen as an example for “early”
up-regulated transcripts.
B: Metallothionein B (MT-B;
CK990996) was
chosen as an example of “late” up-regulated transcripts.
C:
Ependymin (EPN;
CA042089)
was chosen as an example of “early” down-regulated transcripts.
D:
Fatty acid binding protein 2 (FABP2;
CA054659) was
chosen as an example of “late” down-regulated transcripts.
 Figure 5 of Tröße, Mol Vis 2009; 15:1332-1350.