Figure 1. Cataract scores in selected dietary groups throughout the experimental period. The cataract score for each dietary group is
given as the mean of the sums of the scores for both eyes, resulting in a possible maximum score of 8 (4 for each lens). Error
bars show the standard error of the mean (SEM). The number of fish per group (n) varied from 31 to 113.
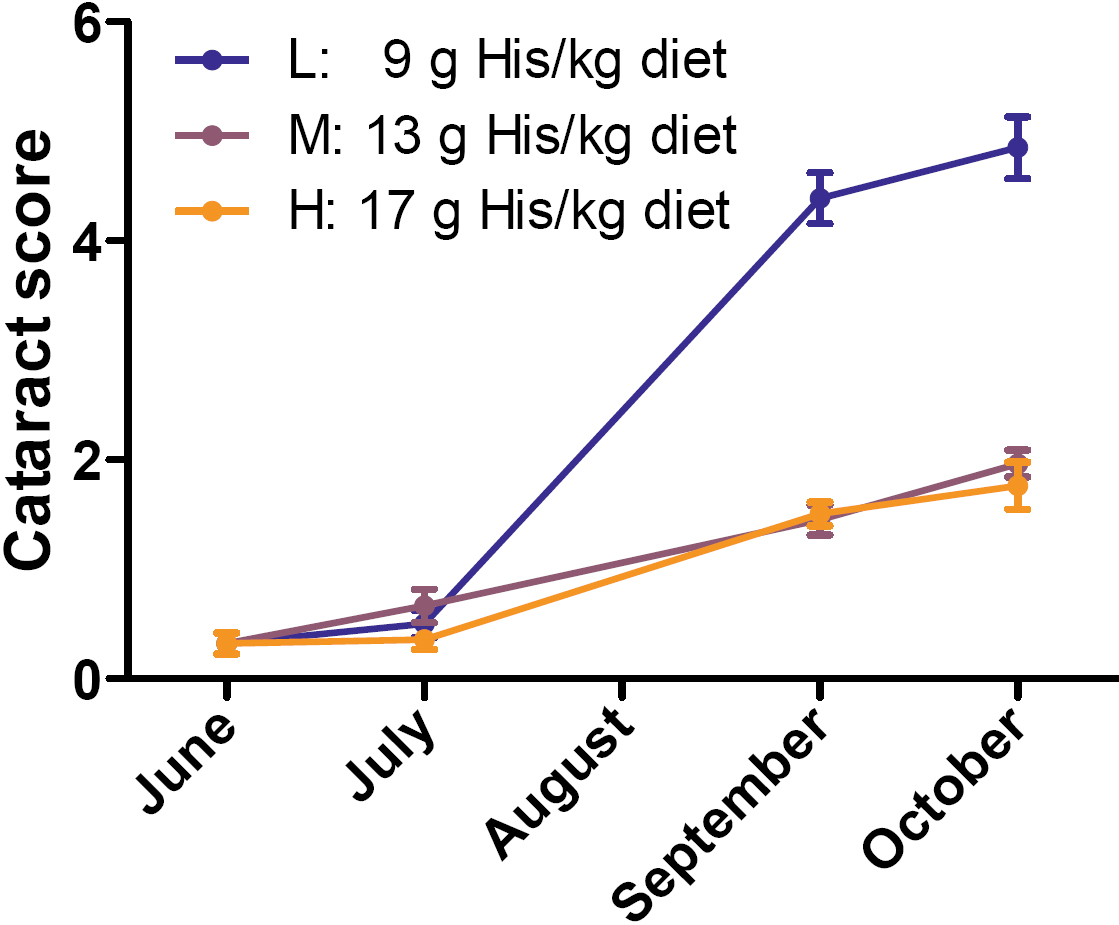
 Figure 1 of
Tröße, Mol Vis 2009; 15:1332-1350.
Figure 1 of
Tröße, Mol Vis 2009; 15:1332-1350.