Figure 8. Growth dynamics of choroidal
neovascularization membranes following subretinal injection. Line and
bar graphs (A-D) display changes in the thickness of choroidal
neovascularization (CNV) membranes at post inoculation (PI) day 3, 7,
10, 14, and 21. CNV formation was more pronounced in eyes following
retinal pigment epithelium (RPE) cells and microbeads with maximal
extension at PI day 7 (A,B). CNV lesions were thicker in
2-month-old C57BL/6 mice compared to age-matched Ccl-2-deficient and
aged 12-month-old C57BL/6 mice (C,D). Bars represent the means
(n=5 eyes/group) at each time point (PI day 3, 7, 10, 14, and 21);
error bars represent standard deviation (SD). The asterisk indicates
p<0.05.
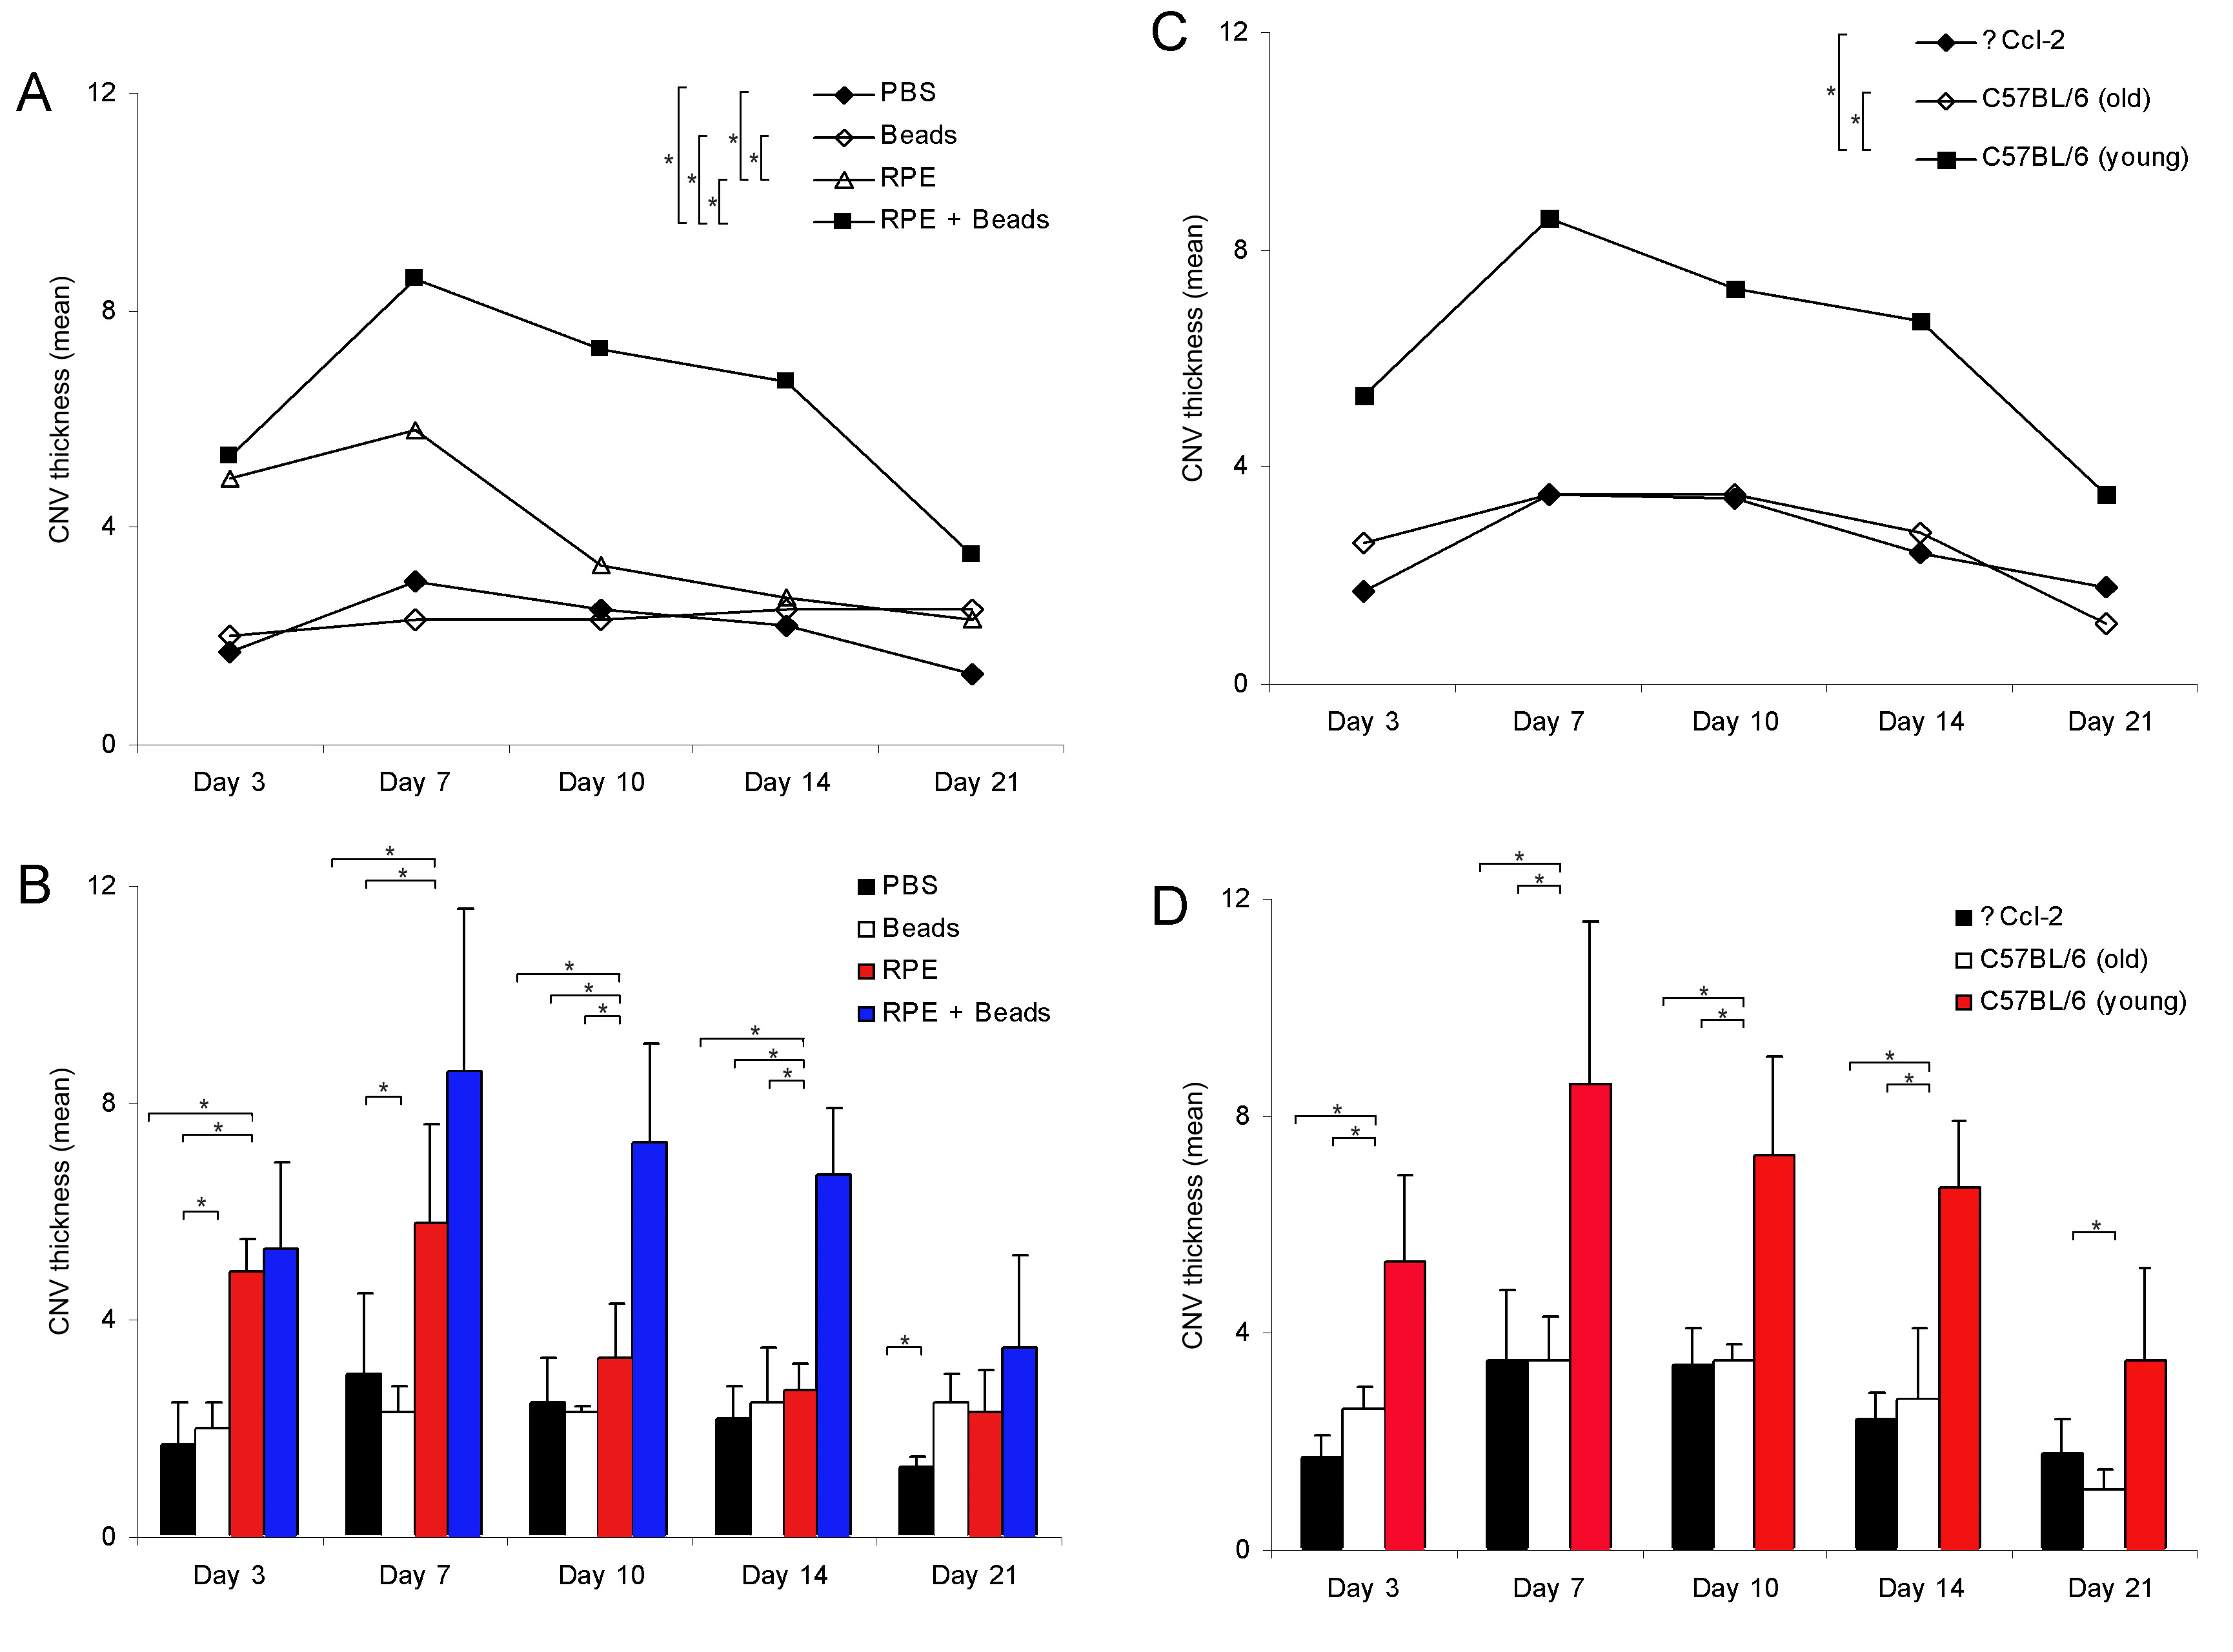
 Figure 8 of Schmack, Mol Vis 2009; 15:146-161.