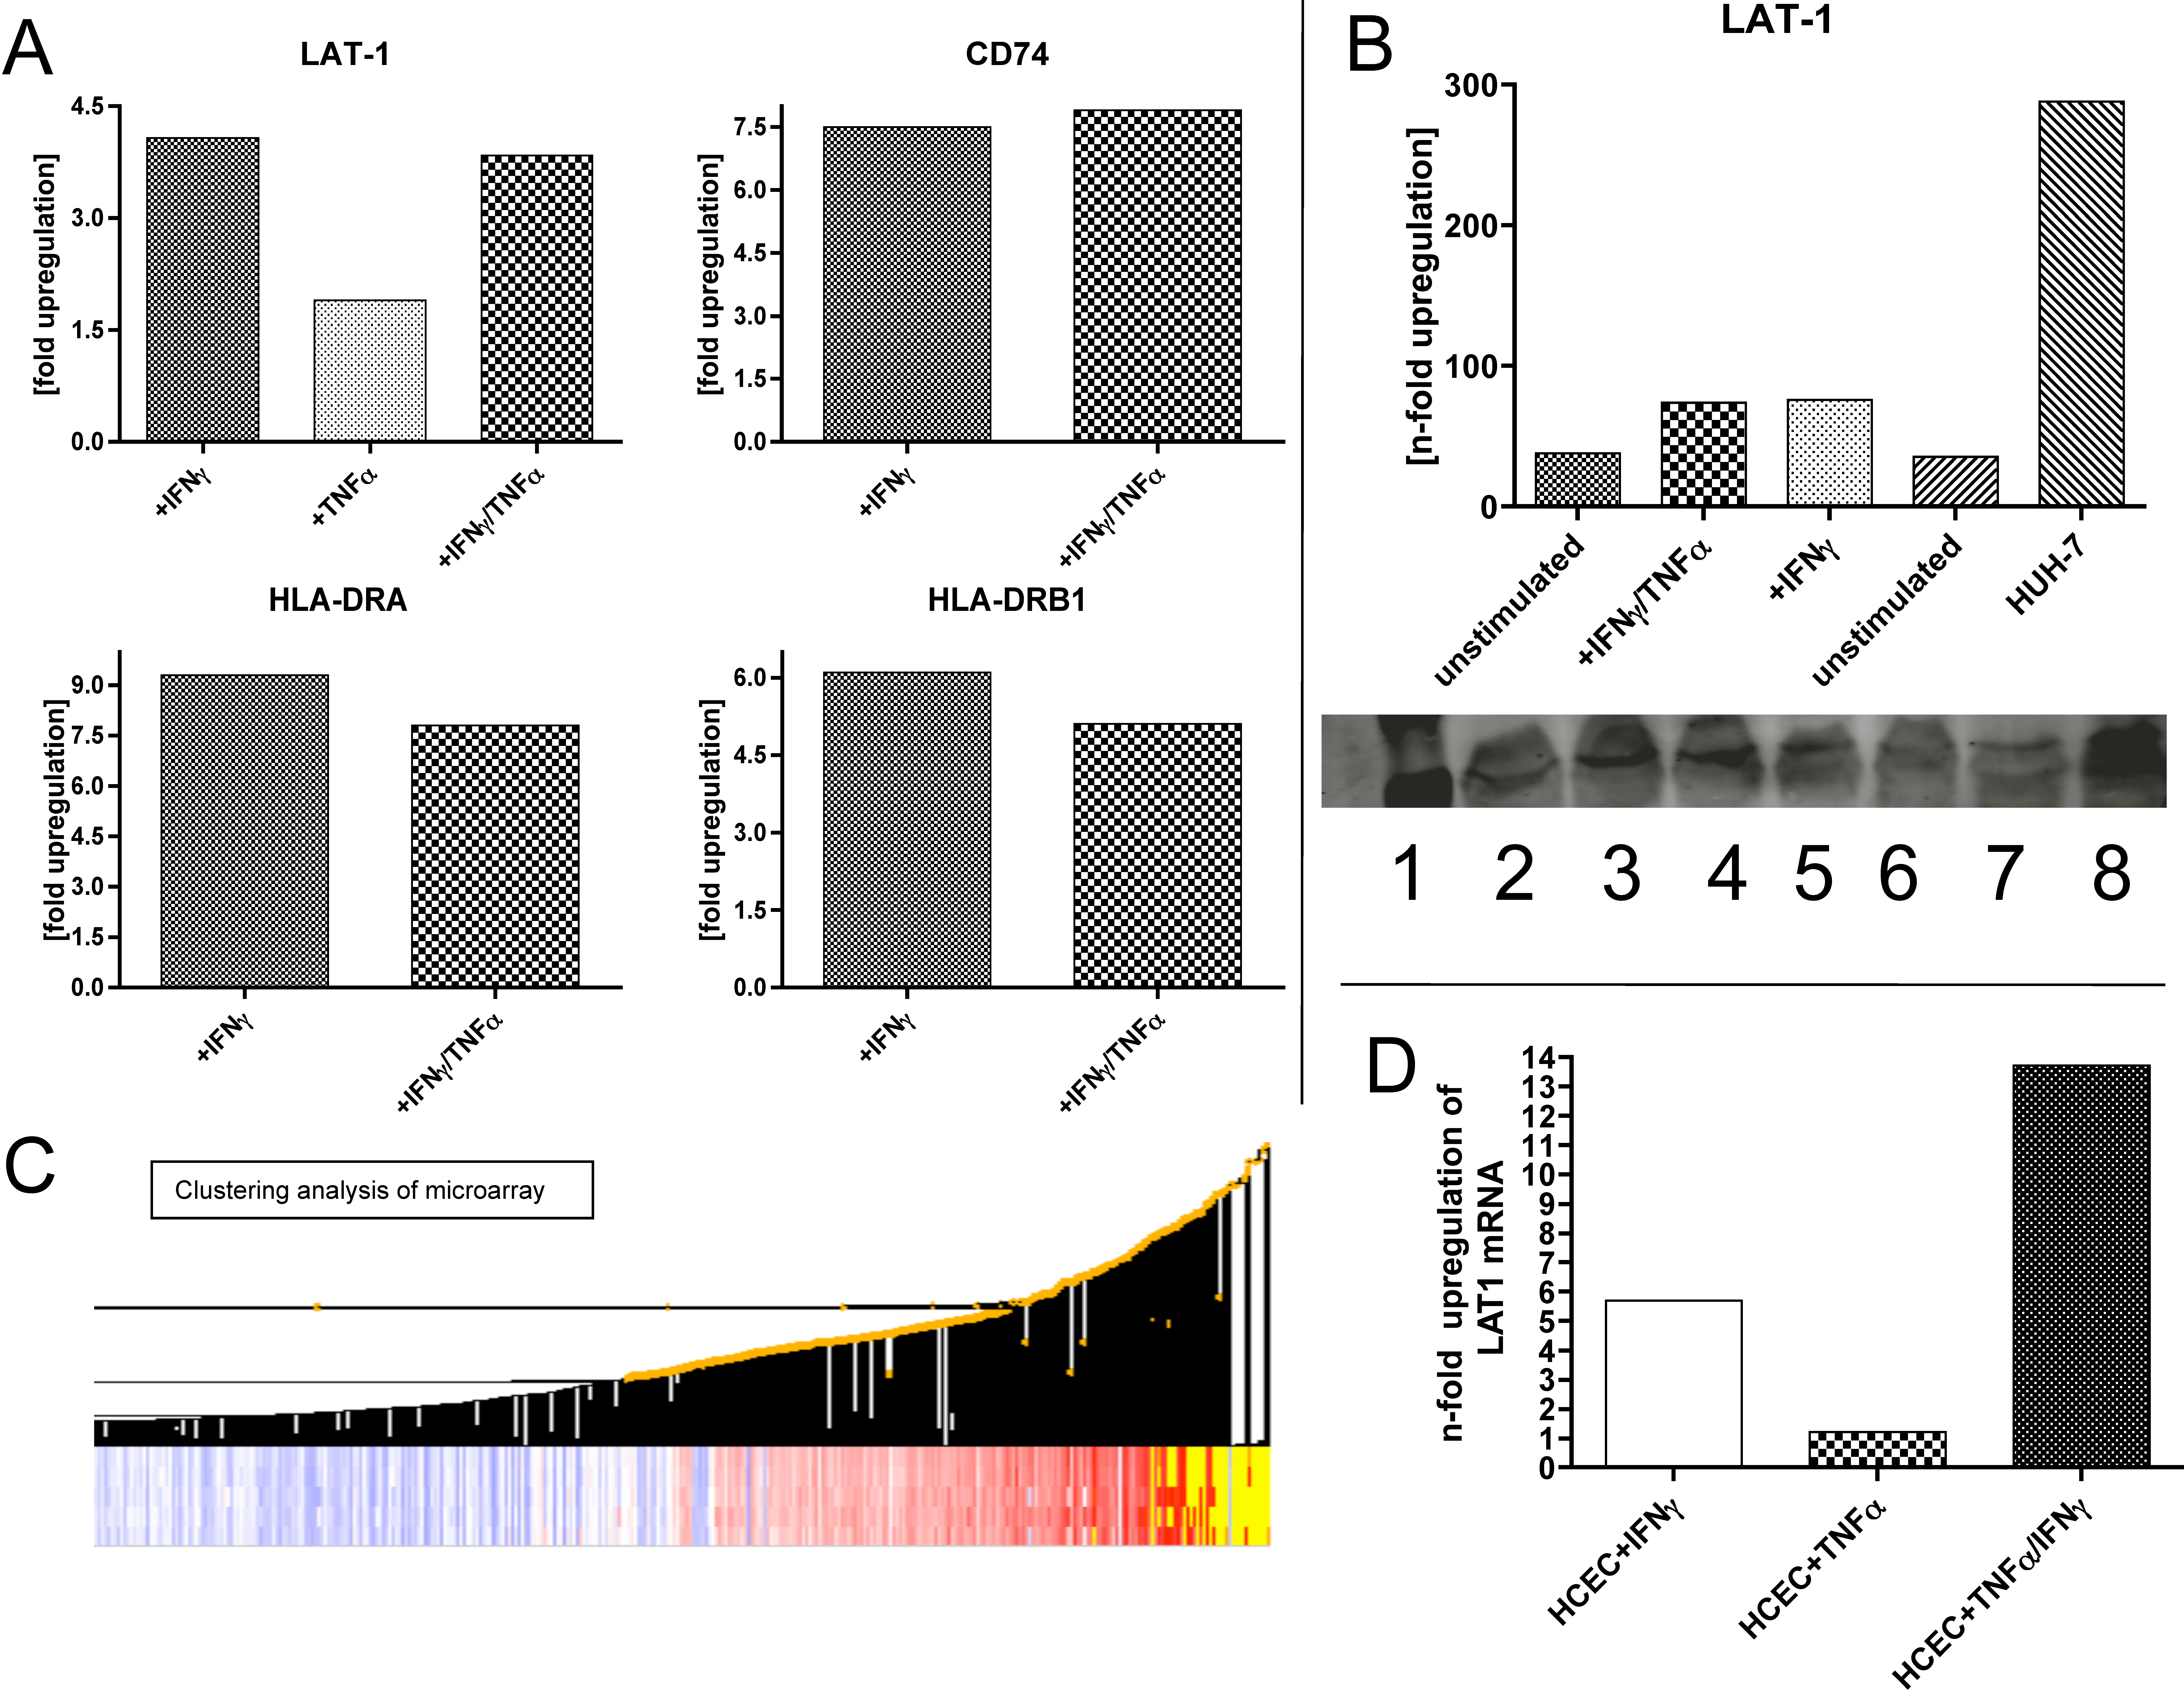
Figure 5. Microarray analysis of HCECs for
LAT1 transporter protein, CD74, HLA-DR, and HLA-DRB1 and western blot
analysis. A:All results shown are normalized against the
control (unstimulated HCECs). We could demonstrate a fourfold
upregulation of the LAT-1 transporter system upon stimulation with
IFN-γ (together with a 2.7 fold upregulation of the class II surface
antigens) and a 3.85 fold upregulation following stimulation with the
cocktail of IFN-γ and TNF-α. However, the stimulation with TNF-α alone
only caused a 1.9 fold upregulation. B: Semi-quantitative
western blot analysis of LAT1 protein: 1=protein ladder (250
D-10 kDa (Bio-Rad), 2=unstimulated HCECs, 3=HCECs stimulated with
IFN-γ, 4=HCECs stimulated with IFN-γ+TNF-α, 5=HCECs stimulated with
IFN-γ, TNF-α+Prostaglandin E2 (as a control to antagonize the
stimulatory effects of IFN-γ+TNF-α), 6=HCECs stimulated with IFN-γ,
TNF-α+Prostaglandin E2+1-MT, 7=HCECs stimulated with TNF-α, 7=HUH-7
liver cell line as control. C: The bottom panel shows the
exemplary clustering analysis of our Affymetrix assay. D:
Upregulation of LAT1 following stimulation with IFN-γ, TNF-α and IFN-γ,
TNF-α was detected by quantitative real-time PCR. The data shown are
normalized against the copy numbers determined from unstimulated HCECs.

 Figure 5 of Serbecic, Mol Vis 2009; 15:1312-1324.
  Figure 5 of Serbecic, Mol Vis 2009; 15:1312-1324.