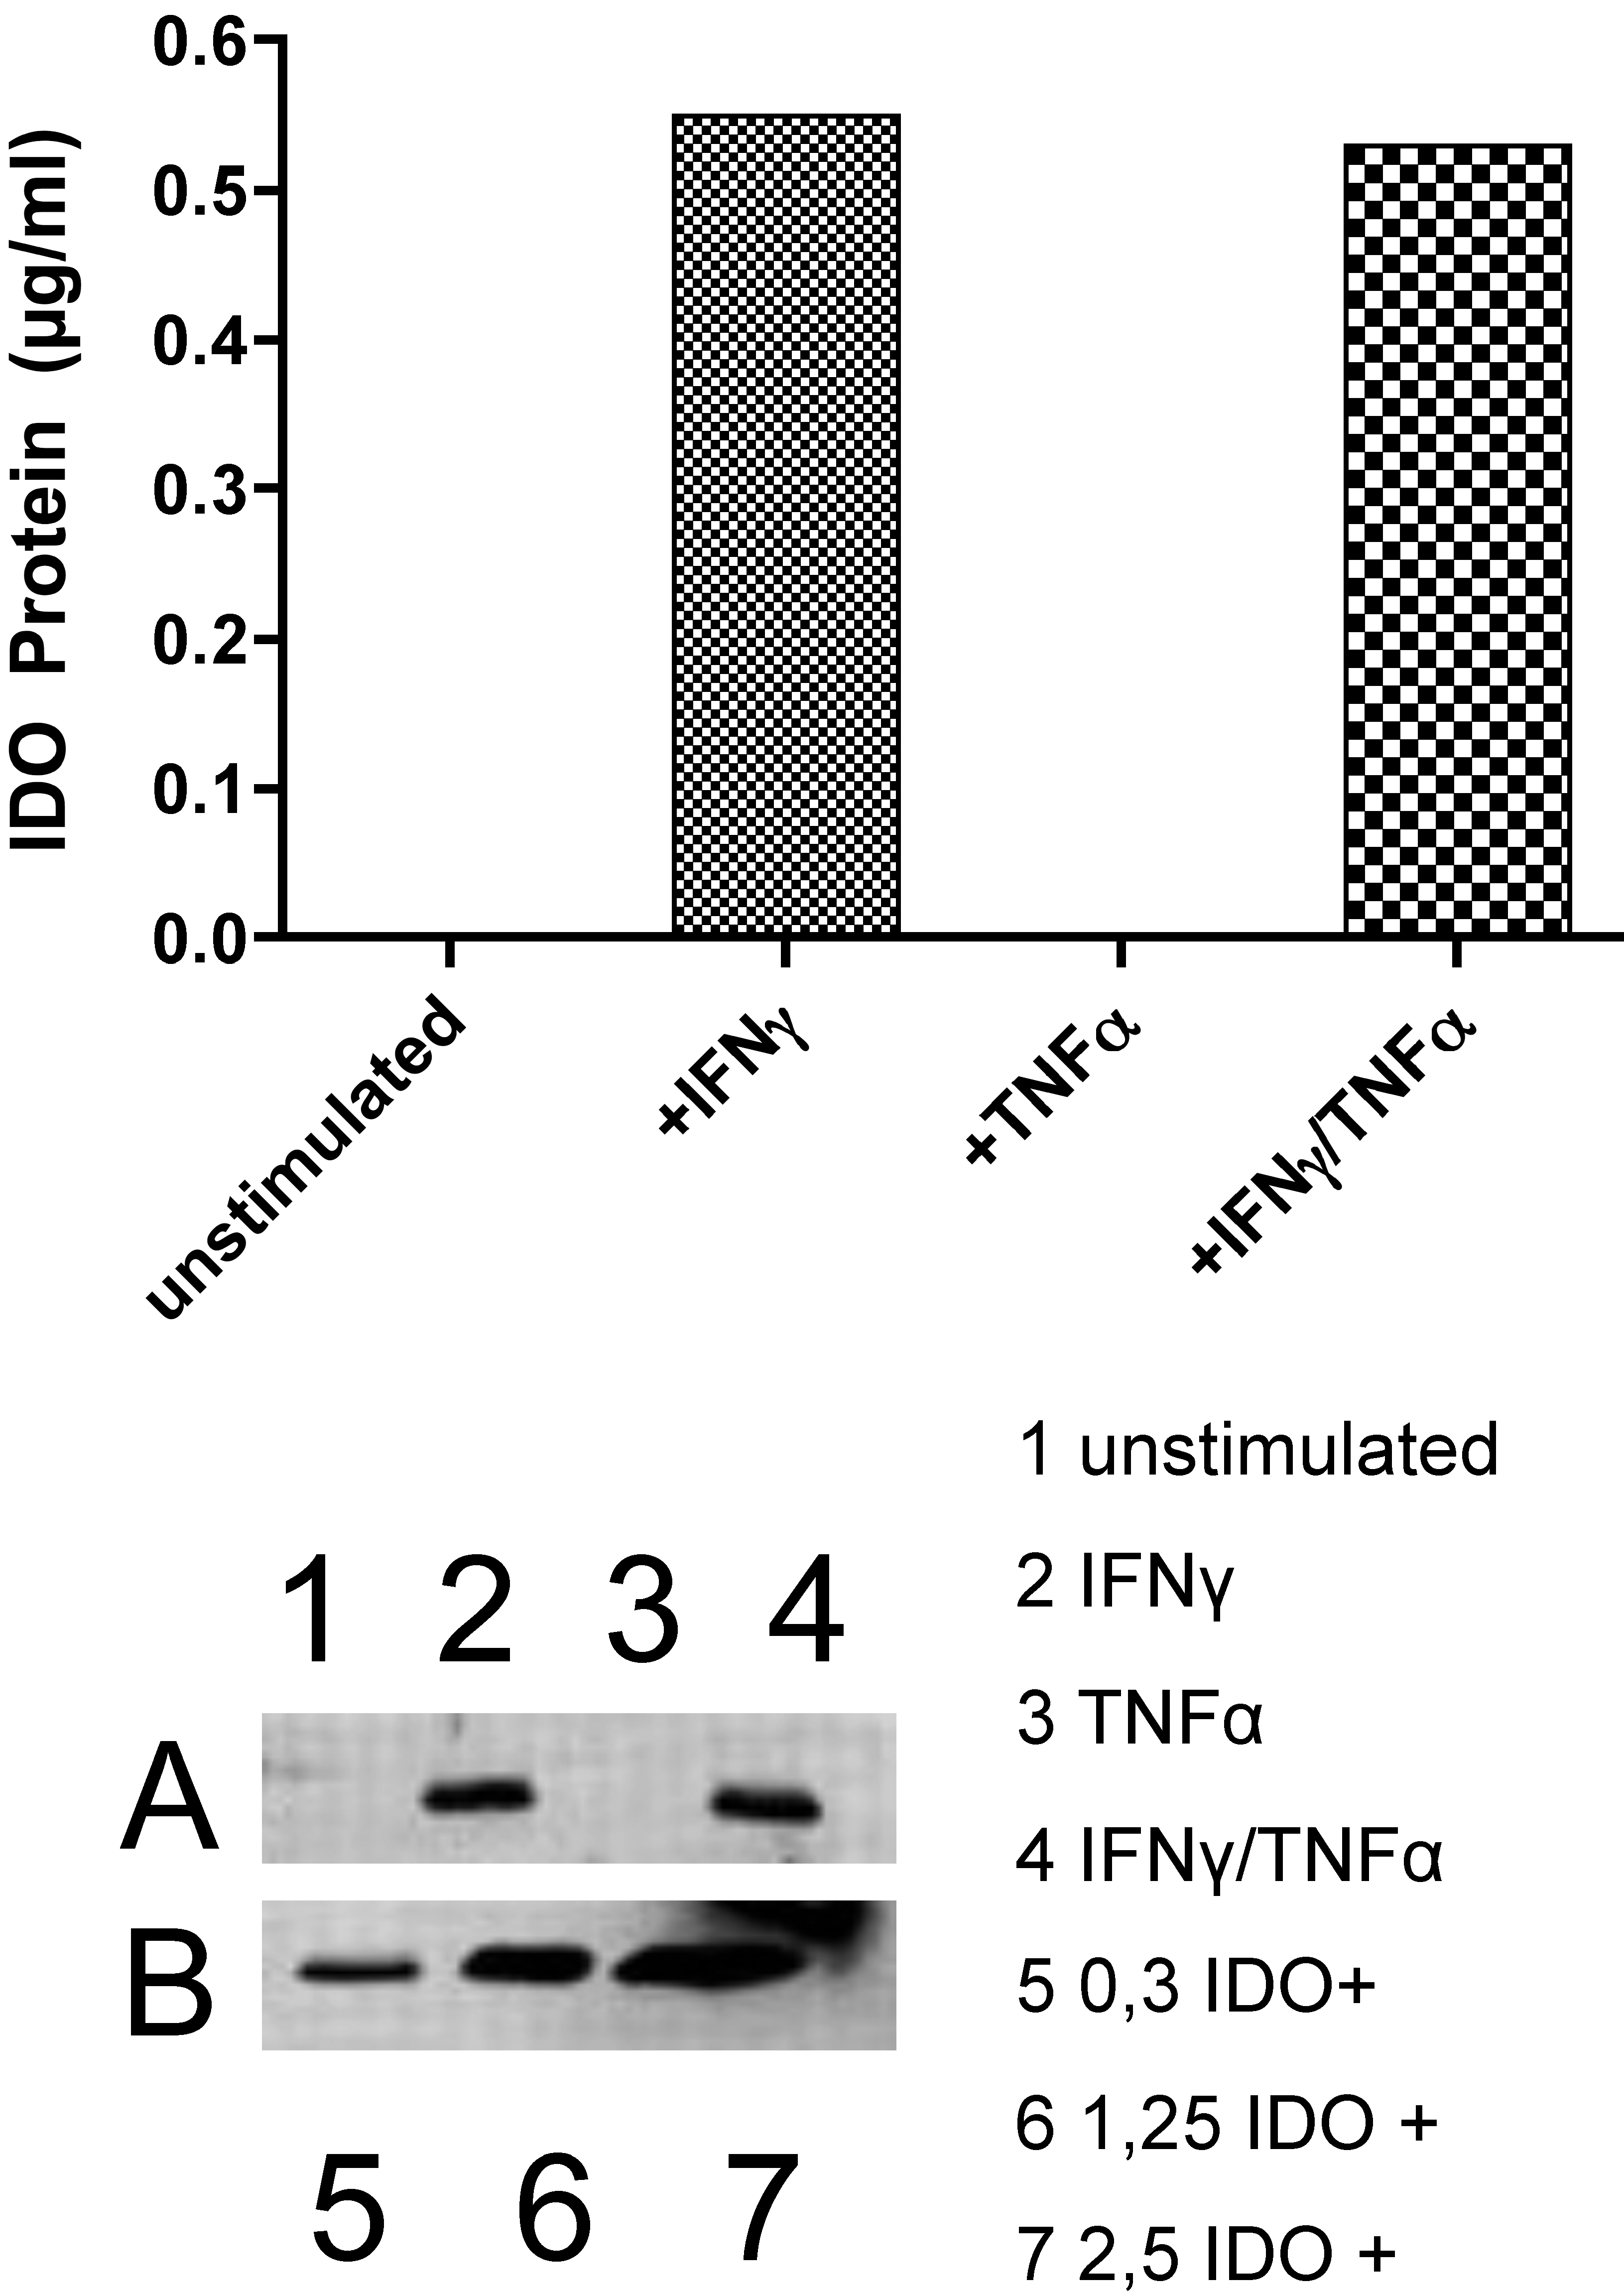
Figure 3. Quantitative determination of
IDO protein in HCECs. The top panel shows the quantification of
A.
HCECs were unstimulated (
A: lane 1) and stimulated with 500
ng/ml IFN-γ (
A: lane 2), 100 U/ml TNF-α (
A: lane 3), or
IFN-γ+100 U/ml TNF-α (
A: lane 4) for 72 h. An undetectable
protein band was found in unstimulated HCECs (
A: lane 1) and
stimulated HCECs with 100 U/ml TNF-α (
A: lane 3).
Obvious
upregulation of protein expression is seen in cytokine stimulation with
500 ng/ml IFN-γ for 72 h (
A: lane 2) and 500 ng/ml IFN-γ+100
U/ml TNF-α for 72 h (
A: lane 4). The bottom panel shows the IDO
control protein at 0.3 µg (
B: lane 5), 1.25 µg (
B: lane
6), and 2.5 µg (
B: lane 7). For the detection of the bands,
protein of three independent experiments has been pooled. Thus, no
error bars will be shown.
 Figure 3 of Serbecic, Mol Vis 2009; 15:1312-1324.