Figure 2. Functional activity of IDO was
determined by measuring the concentration of L-kynurenine and
L-tryptophan in the tissue culture supernatant of pooled HCECs. HCECs
were treated with 500 ng/ml IFN-γ, 100 U/ml TNF-α, 500 ng/ml IFN-γ+100
U/ml TNF-α, or without any of the cytokines. After 72 h, the cell
culture supernatants were harvested, and the concentrations of
L-kynurenine (A) and L-tryptophan (B) were detected by
HPLC. The difference between the IFN-γ or cocktail stimulated HCECs
versus the unstimulated or TNF-α only stimulated HCECs was highly
significant (p<0.03). The chromatograms (C) show the total
free L-kynurenine (top) and L-tryptophan (bottom) of stimulated HCECs.
As indicated by arrows, the retention times are different regarding
L-kynurenine and L-tryptophan. Interestingly, below L-kynurenine, no
further downstream metabolites of the IDO pathway were detected.
Furthermore, no L-kynurenine (0.0 µmol) was detected in the
unstimulated group or in the TNF-α stimulated group. The bars shown do
represent the mean±standard deviation (SD).
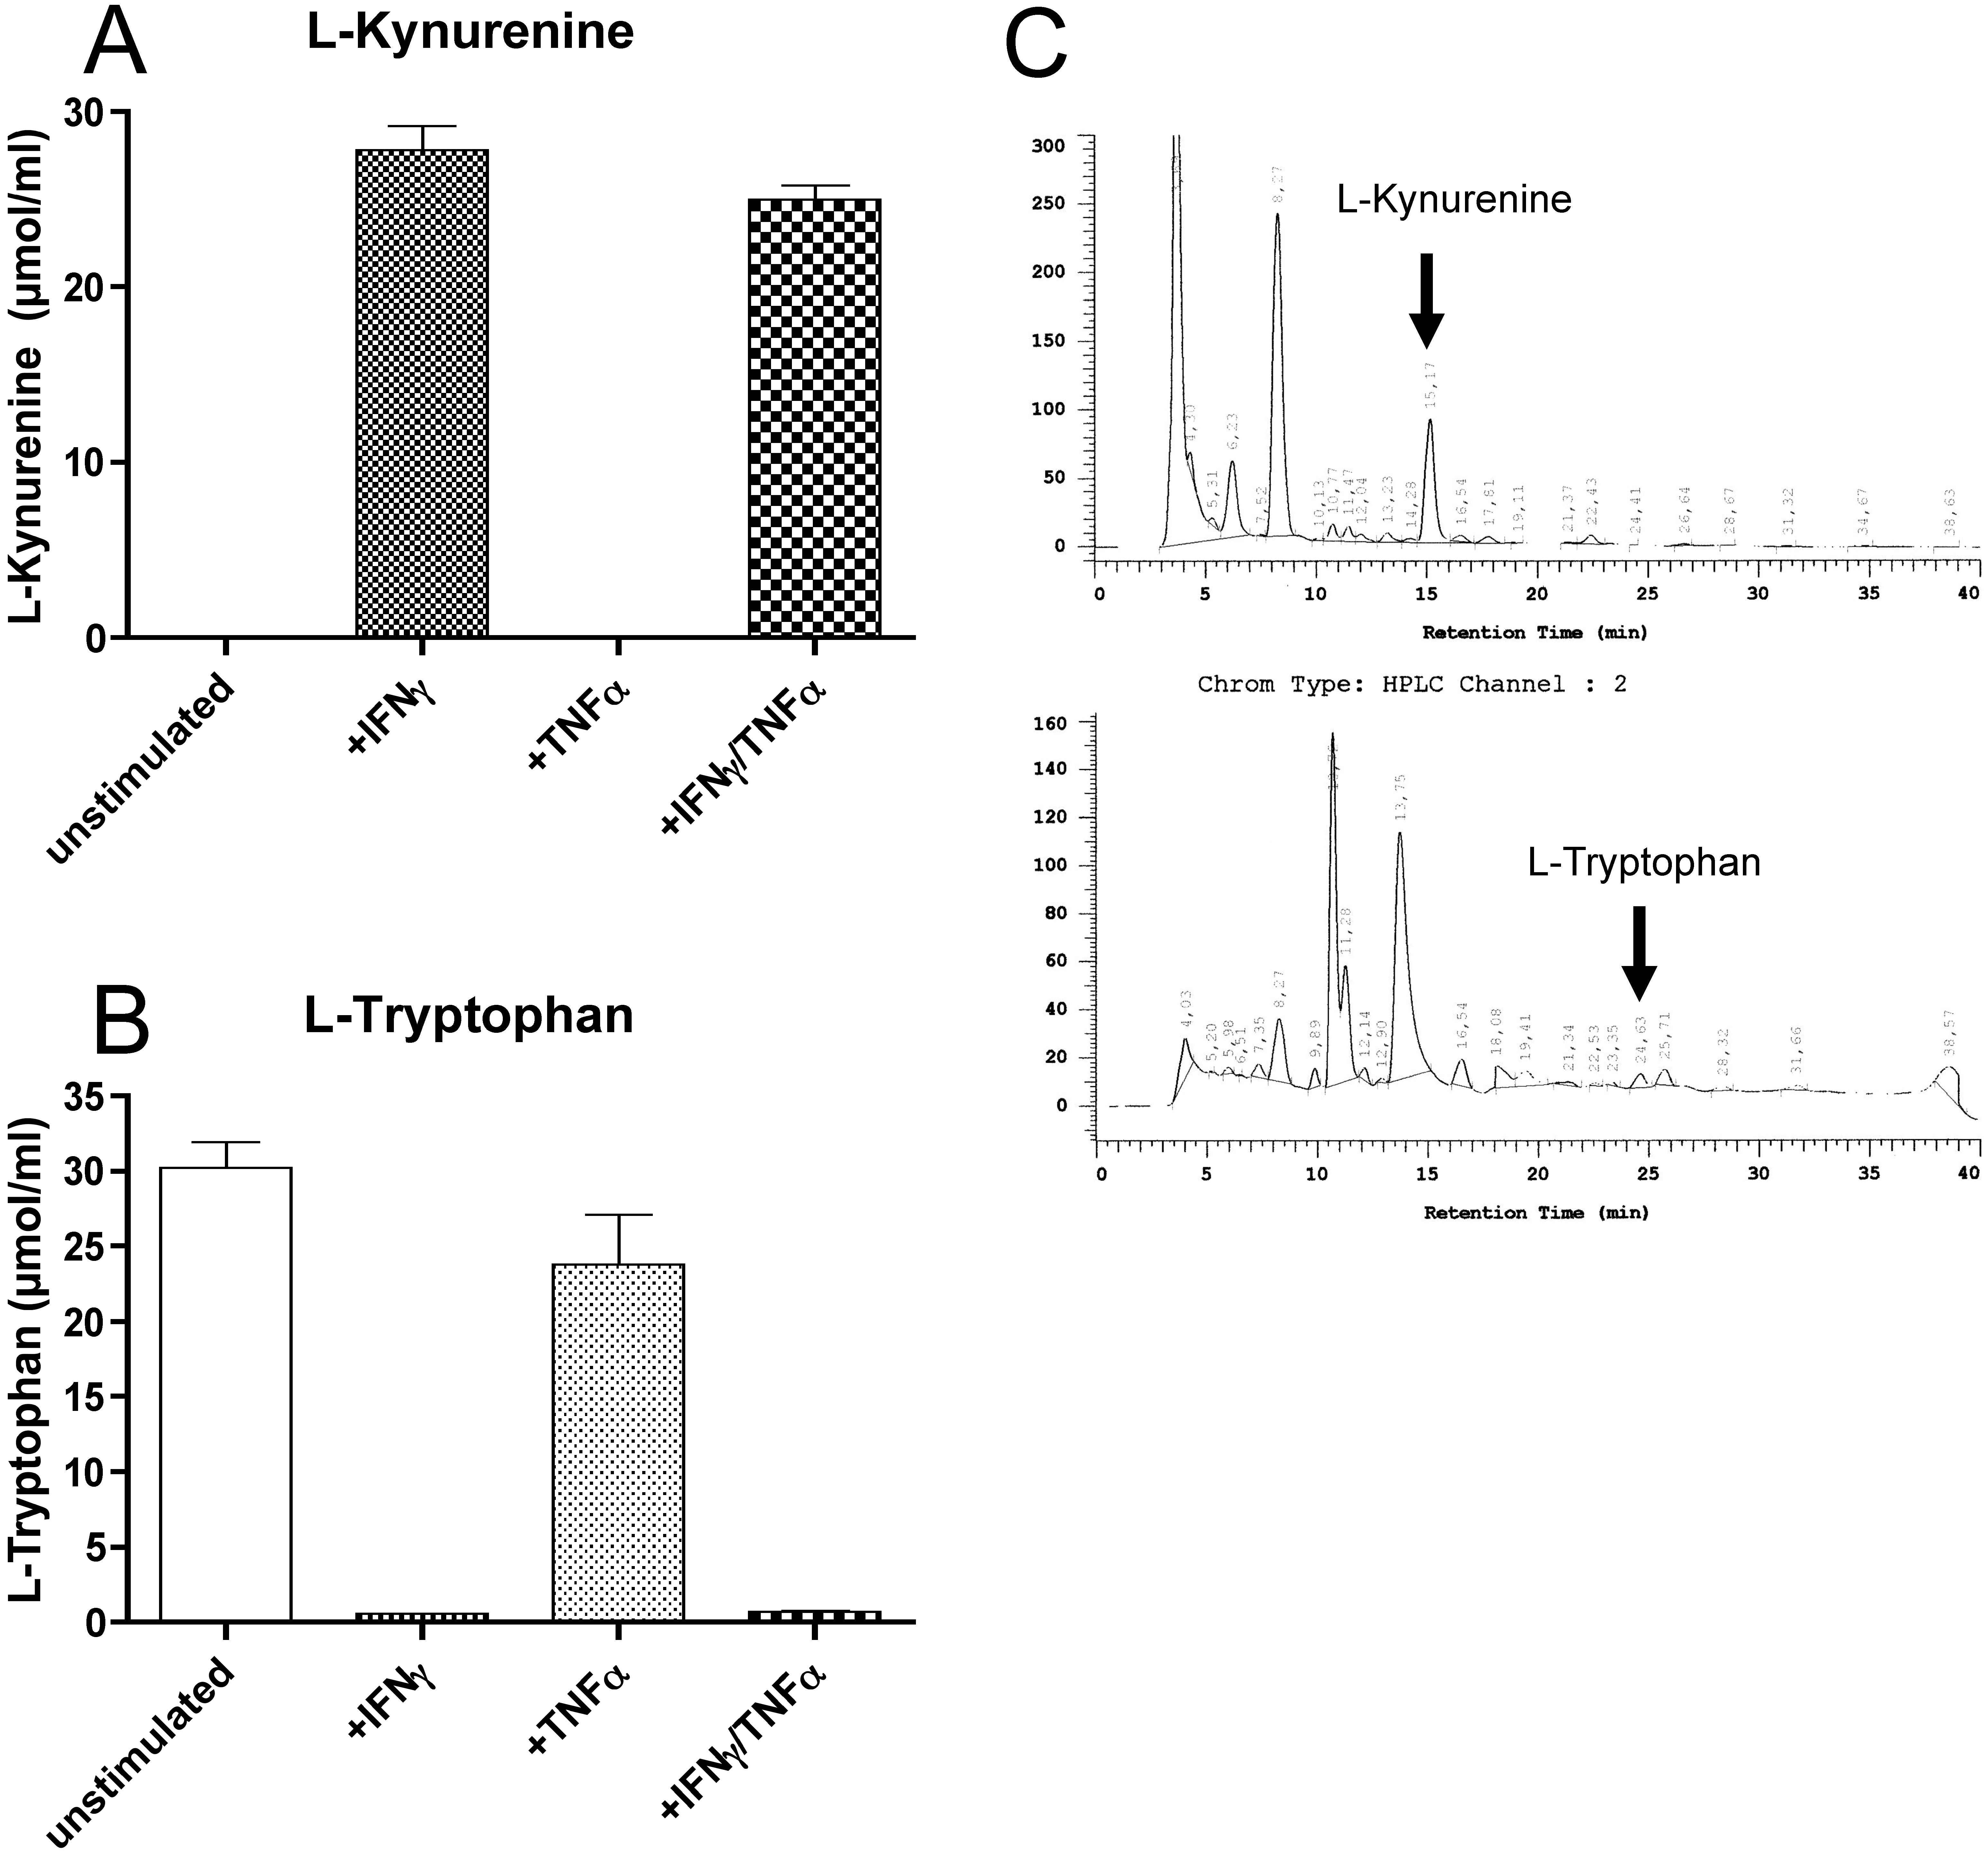
 Figure 2 of Serbecic, Mol Vis 2009; 15:1312-1324.