Figure 5. ELISA analysis of MIP-2, KC, IL-1β, and IL-6 protein expression in A. fumigatus-induced mouse cornea. A shows protein expression levels of MIP-2, KC, IL-1β, and IL-6 for the infected group on days 1, 3, 5, and 7 post-infection.
B shows protein expression levels of MIP-2 and KC in the MIP-2 treated group. Here, the MIP-2 protein expression levels were
lower compared to the infected group. C shows protein expression levels of MIP-2 and KC in the IL-1β treated group. This bar chart illustrates that the protein expression
levels of MIP-2 and KC on days 1 and 3 were lower compared to the infected group on those same days. The asterisks indicate
significance levels assessed via ANOVA followed by post-hoc tests: one asterisk indicates p<0.05 and two asterisks denote
p<0.01.
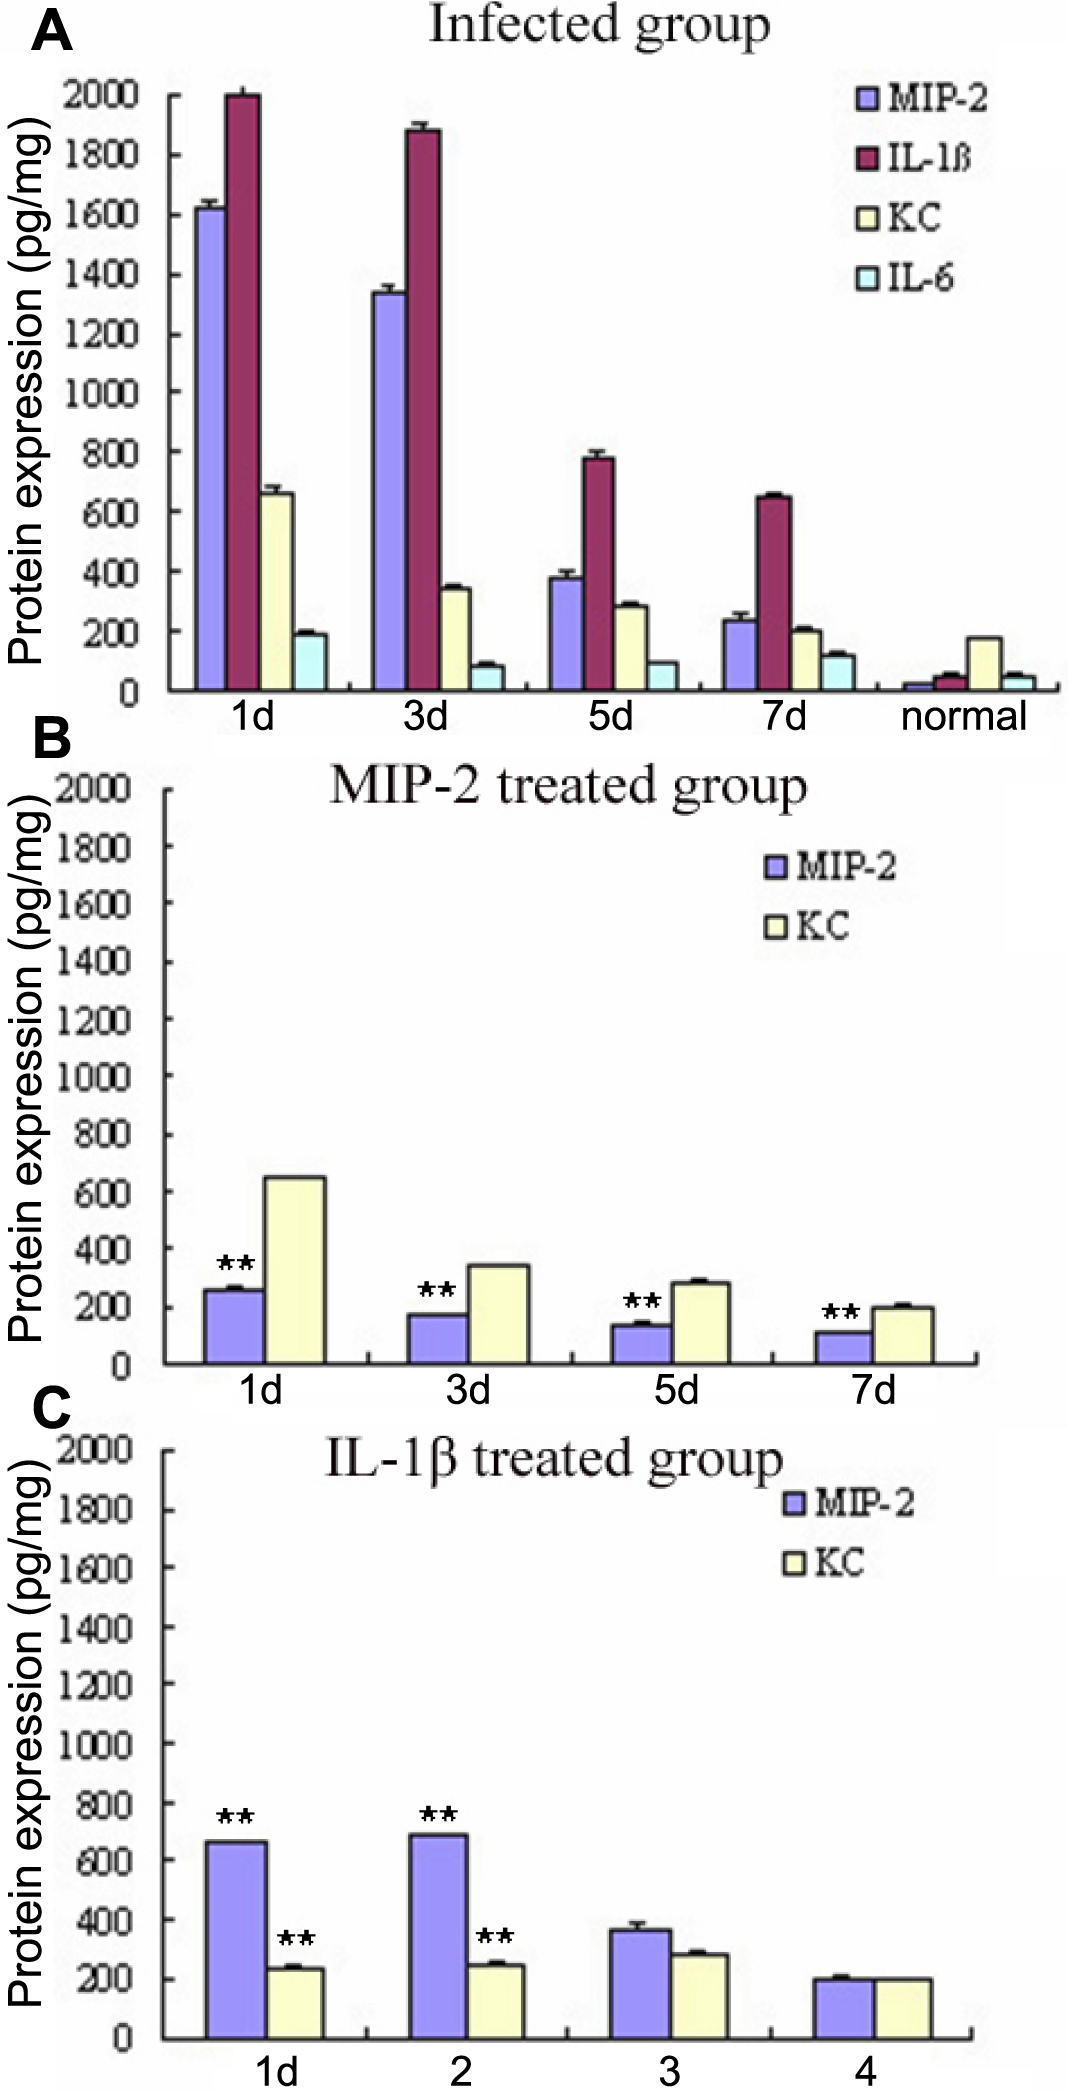
 Figure 5 of
Zhong, Mol Vis 2009; 15:1303-1311.
Figure 5 of
Zhong, Mol Vis 2009; 15:1303-1311.