Figure 3. Histopathology of A. fumigatus-induced keratomycosis in mice. A, B, C, and D show the inflammatory changes on days 1, 3, 5, and 7 post-infection in the infected group (magnification 400X). E, F, G, and H show the fungal hyphae in the infected group (magnification 400X). I, J, K, and L represent the inflammatory changes in the MIP-2 treated group. Here, the inflammatory responses were significantly reduced
at all time points (magnification 400X). M, N, O, and P represent the inflammatory changes in the IL-1β treated group. The inflammatory responses were significantly reduced on days
1 and 3 post-infection (magnification 400X). The bar chart shows the pathological scores obtained in a semi-quantitative way.
The asterisks indicate significance levels assessed via ANOVA followed by post-hoc tests: one asterisk indicates p<0.05 and
two asterisks indicate p<0.01.
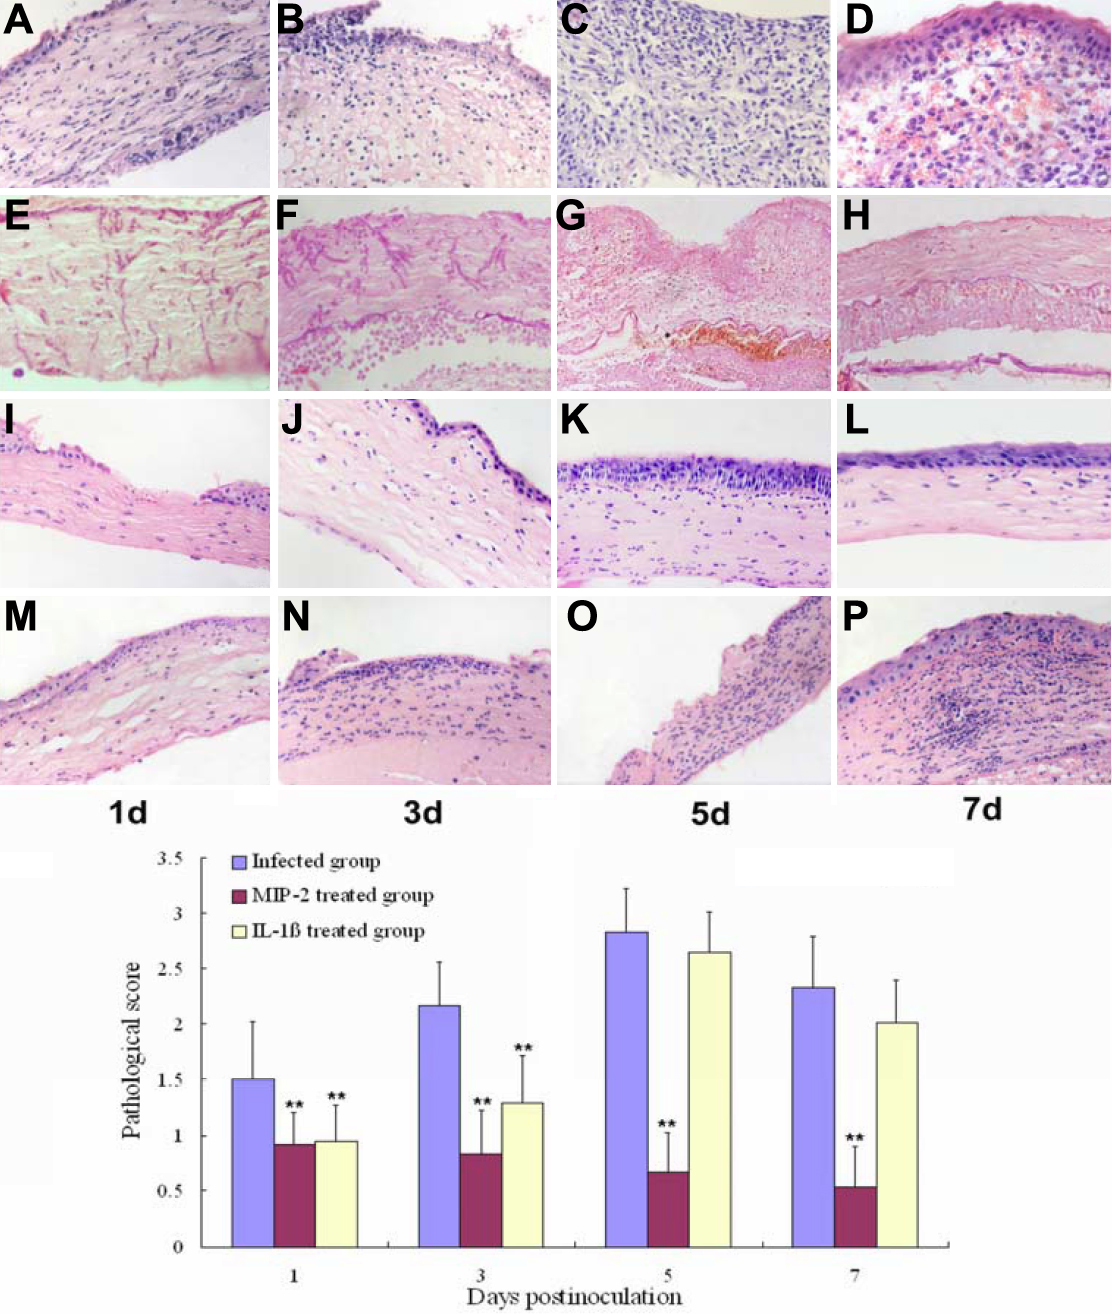
 Figure 3 of
Zhong, Mol Vis 2009; 15:1303-1311.
Figure 3 of
Zhong, Mol Vis 2009; 15:1303-1311.