Figure 6. Muscarinic agents and mouse
scleral fibroblast cell proliferation. A: The effect of
muscarinic agents on mouse scleral fibroblast cell proliferation is
illustrated on the graph. SFs were incubated with atropine,
pirenzepine, carbachol, himbacine, and 4-DAMP at 0.1–100 μM and with
muscarinic toxin-7 (MT-7), muscarinic toxin-1 (MT-1) at 0.1, 1, 2, 4 μM
all for 24 h, and BrdU incorporation was measured by ELISA. Antagonists
significantly inhibited DNA synthesis in a dose-dependent manner
(p<0.05, ANOVA, n=4). In contrast, muscarinic receptor agonists,
carbachol and MT-1, increased cell proliferation in a dose-dependent
manner (p<0.05, ANOVA, n=4). Data are represented as mean±SEM. The
asterisk indicates p<0.05 versus control (Post Hoc Analysis; Tukey
Honest Significant Difference). B: Effects of muscarinic agents
on cell proliferation of human scleral fibroblasts are shown. Scleral
fibroblasts were incubated with atropine, pirenzepine, carbachol, and
atropine/carbachol at 0.1–100 μM for 24 h, and BrdU incorporation was
measured by ELISA. Antagonists significantly inhibited DNA synthesis in
a dose-dependent manner (p<0.05, ANOVA, n=4). In contrast,
muscarinic receptor agonist, carbachol, increased cell proliferation in
a dose-dependent manner (p<0.05, ANOVA, n=4). Atropine was more
effective at 10 and 100 μM than pirenzepine at all of the
concentrations. Data are represented as mean±SEM. The asterisk
indicates p<0.05 versus control (Post Hoc Analysis; Tukey Honest
Significant Difference).
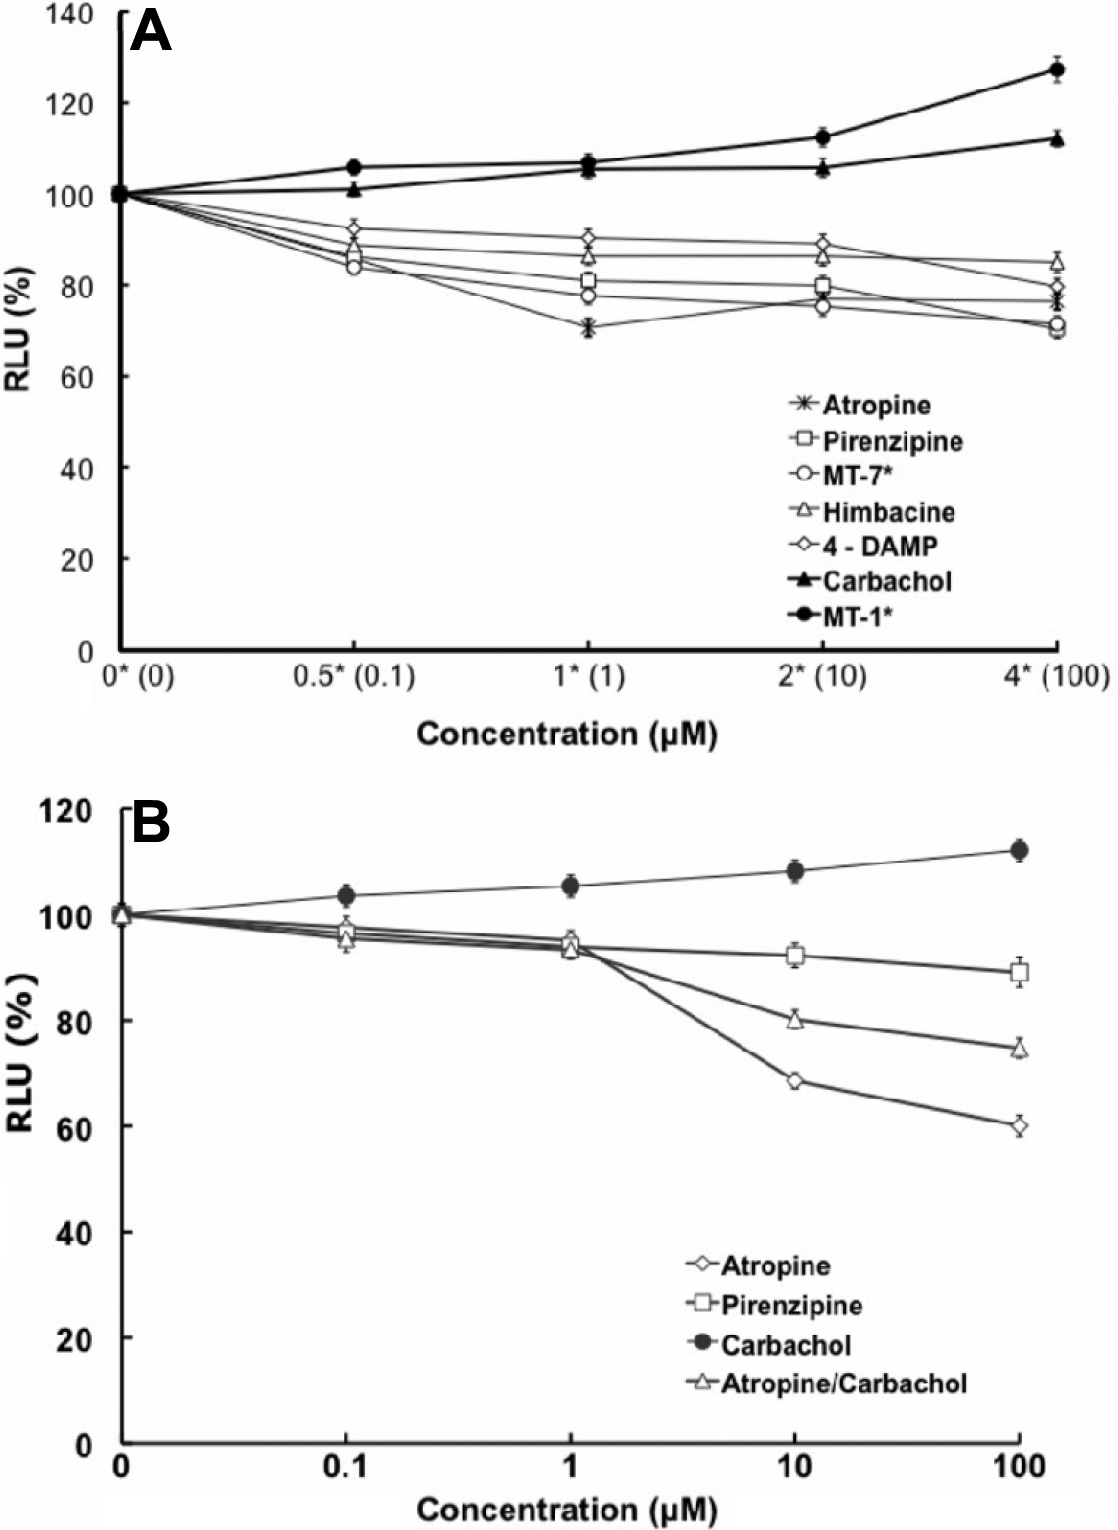
 Figure 6 of Barathi, Mol Vis 2009; 15:1277-1293.