Figure 5. Muscarinic receptor protein expression. A: Immunoreactive bands corresponding to each muscarinic receptor subtype in mouse scleral fibroblasts and their estimated
molecular weights are shown: ~58 kDa (M1), ~52 kDa (M2), ~52 kDa (M3), ~66 kDa (M4), and ~65 kDa (M5). Blots are representative data from at least three independent experiments. B: Immunoreactive bands corresponding to each muscarinic receptor subtypes in human scleral fibroblasts and their estimated
molecular weights are shown: ~57 kDa (M1), ~52 kDa (M2), ~56 kDa (M3), ~58 kDa (M4), and ~51 kDa (M5). Blots are representative data from at least three independent experiments. Molecular standards (50-75 kDa) were run on
the same blot parallel with muscarinic receptor proteins. The positions are shown in the left hand side.
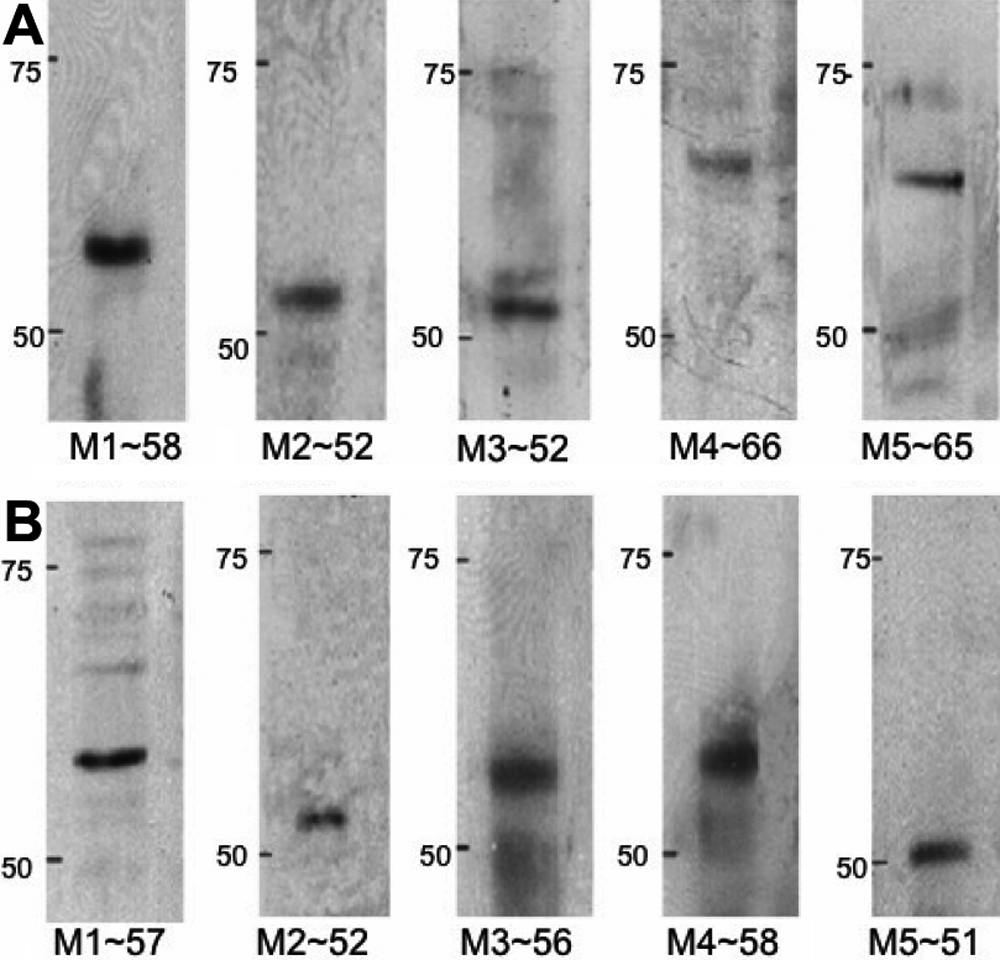
 Figure 5 of
Barathi, Mol Vis 2009; 15:1277-1293.
Figure 5 of
Barathi, Mol Vis 2009; 15:1277-1293.