Figure 4. Muscarinic receptor sub-types
transcript levels in mouse sclera. The bar graph compares the relative
gene expression of mouse scleral muscarinic receptor subtypes to the
corresponding mouse brain mRNA level (range) after normalization with
18S rRNA internal standard. The mRNA level of M1, M3,
and M4 in mouse sclera was less than in the mouse
brain. However, the mRNA level of M2 and M5
was abundant in the mouse sclera.
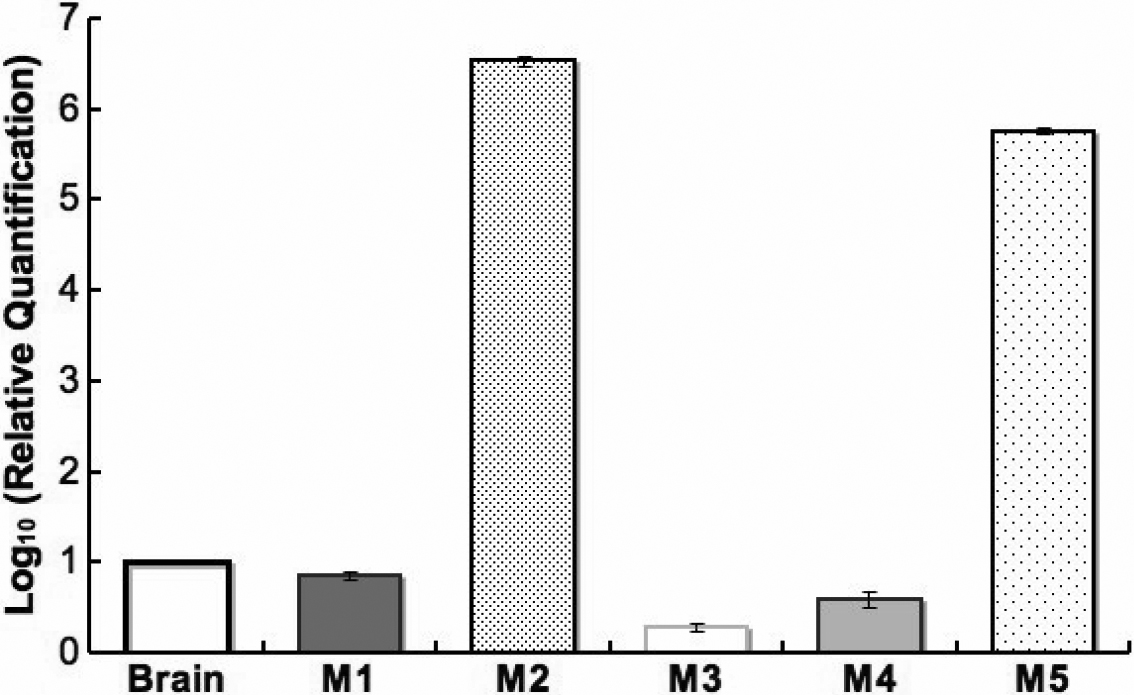
 Figure 4 of Barathi, Mol Vis 2009; 15:1277-1293.