Figure 3. Gene expression of muscarinic receptor subtypes A: RT–PCR identified cDNA for M1-M5 in human scleral fibroblasts. Lane 1: DNA ladder; lane 2: M1; lane 3: M2; lane 4: M3; lane 5: M4; lane 6: M5. PCR products of the expected sizes were as follows: M1, 538 bp; M2, 654 bp; M3, 560 bp; M4, 503 bp; and M5, 752 bp. The identity of the products was confirmed by sequencing. B: RT–PCR identified cDNA for M1-M5 in mouse scleral fibroblasts. Lane 1: DNA ladder; lane 2: mouse brain as a positive control; lane 3: mouse sclera. PCR products
of the expected sizes were as follows: M1, 139 bp; M2, 69 bp; M3, 91 bp; M4, 122 bp; and M5, 76 bp. C: β-actin as internal control, 314 bp for all cDNAs used. Lane 1: DNA ladder; lane 2: mouse brain; lane 3: human sclera; lane 4: mouse
sclera. D: Water was used as a negative control. Lane 1: DNA ladder; lane 2: M1; lane 3: M2; lane 4: M3; lane 5: M4; lane 6: M5. Identity of the products was confirmed by sequencing (see Methods for detailed information).
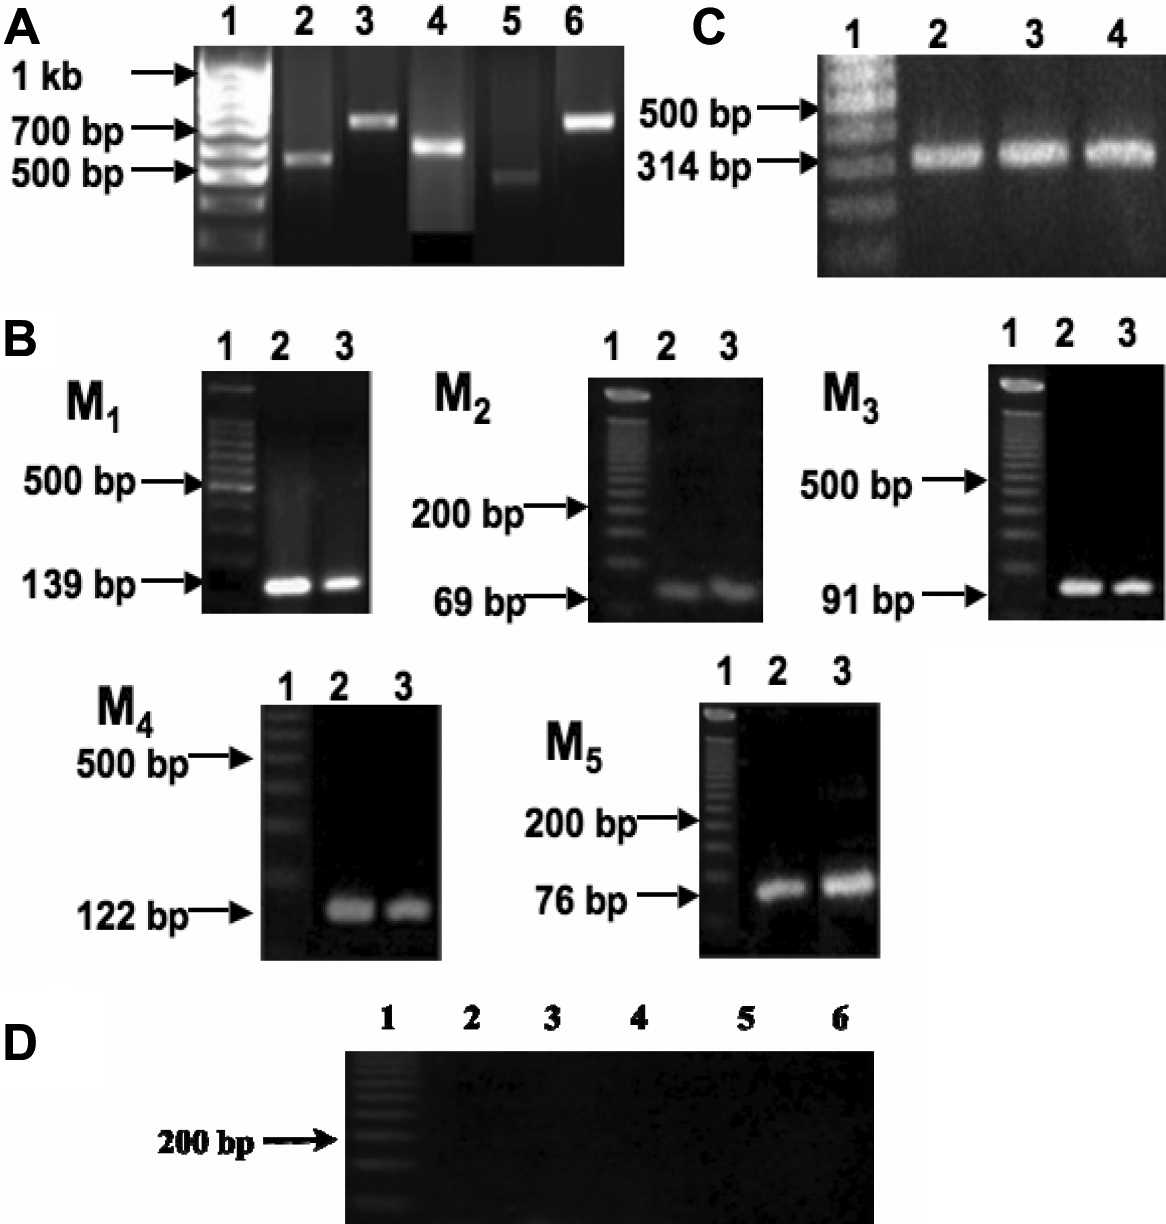
 Figure 3 of
Barathi, Mol Vis 2009; 15:1277-1293.
Figure 3 of
Barathi, Mol Vis 2009; 15:1277-1293.