Figure 3. TNF-α expression in corneas of different groups determined by ELISA. The data are presented as the mean±standard error of
results from three independent experiments. ELISA showed a markedly upregulated activity of NF-κB in infected corneas of saline-treated
mice (HSK) and LOR-treated mice (HSK+LOR) when compared to levels in the mock-infected cornea (Control). LOR treatment significantly
inhibited TNF-α expression in the cornea at each indicated time point. The asterisk indicates that p<0.05 when compared to
the control group, and the hash mark denotes that p<0.05 for the HSK+LOR group when compared to the HSK group at the same
time point.
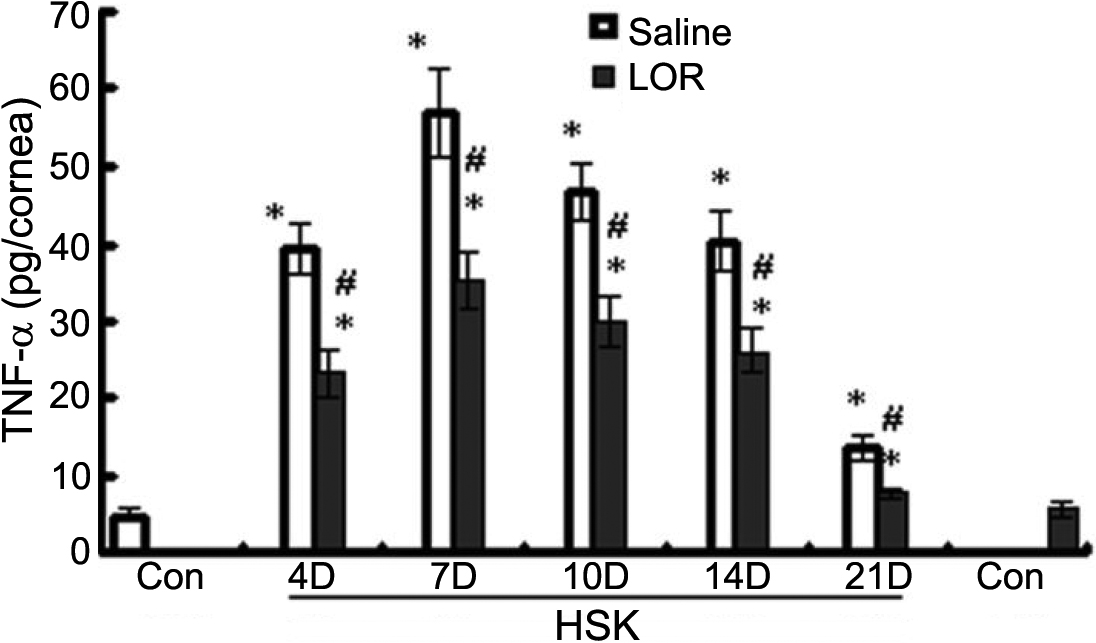
 Figure 3 of
Yin, Mol Vis 2009; 15:1252-1259.
Figure 3 of
Yin, Mol Vis 2009; 15:1252-1259.