Figure 2. Electrophoretic mobility shift assessment of the DNA-binding activity of NF-κB in the cornea of different groups. A: Nuclear extracts were probed for NF-κB binding activity. Lane 1: mock-infected group (Control); lanes 2, 4, 6, 8, and10:
Reactivated, saline-treated group (HSK) on days 4, 7, 10, 14, and 21, respectively; lanes 3, 5, 7, 9, and 11: Reactivated,
LOR-treated group (HSK+LOR) on days 4, 7, 10, 14, and 21, respectively; lane 12: mock-infected group treated with lornoxicam
(LOR). The data are representative of three independent experiments. B: Quantitative analysis is displayed of NF-κB activity by EMSA at days 4, 7, 10, 14, and 21 after irradiation in corneas of
ICR mice treated with either saline or LOR. The bands were quantified using image analysis software (Bandleader 3.0 software, Magnitec Ltd. Tel Aviv, Israel). The relative intensity was determined by comparison with that of the background. The data are presented
as mean±standard error of results from three independent experiments. EMSA shows a markedly upregulated activity of NF-κB
in the HSK group and HSK+LOR group compared to levels in the control group, and this upregulation was dramatically suppressed
by LOR treatment at each indicated time point. The asterisk indicates that p<0.05 when compared to the control group. The
hash mark indicates that p<0.05 for the HSK+LOR group when compared to the HSK group at the corresponding time points.
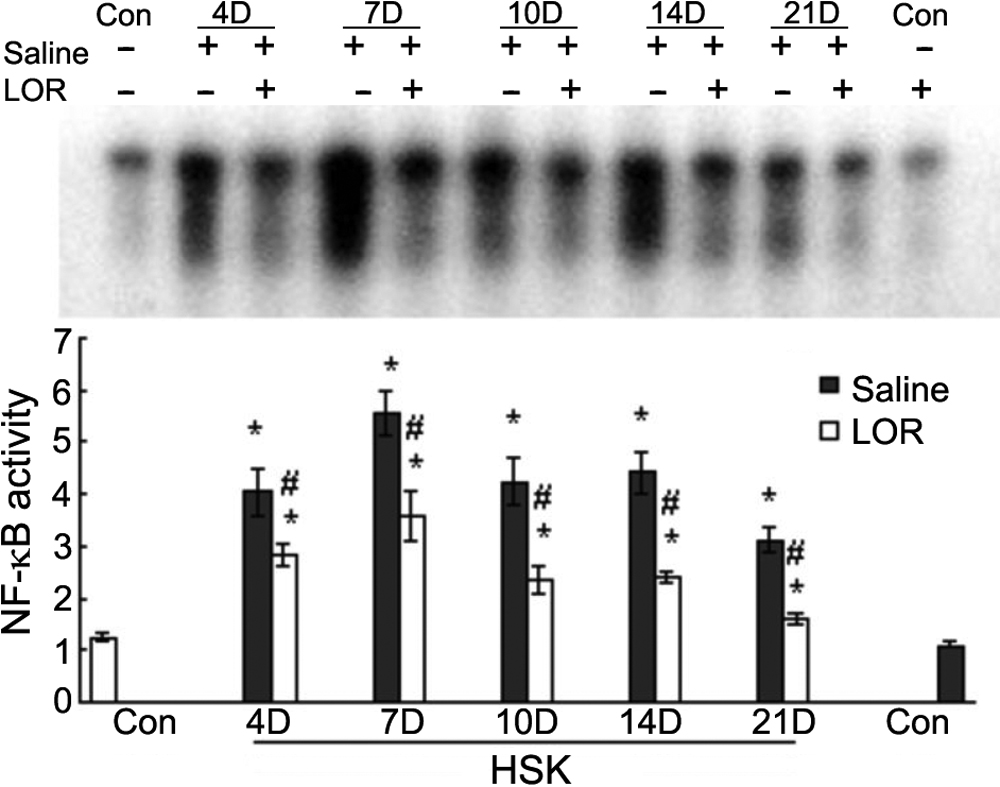
 Figure 2 of
Yin, Mol Vis 2009; 15:1252-1259.
Figure 2 of
Yin, Mol Vis 2009; 15:1252-1259.