Figure 2. Expression of CB1, CB2,
and FAAH mRNA in human primary RPE cells and changes of CB1,
CB2, FAAH mRNA and protein expression in 200 μM H2O2-treated
ARPE-19 cells compared to untreated ones. A: Expression of CB1,
CB2, and FAAH mRNA expression in human primary RPE cells
assayed by real time RT–PCR method. B: Changes of CB1, CB2,
and FAAH mRNA expression in ARPE-19 cells assayed by real time
RT–PCR method. Asterisk (*) represents the correlation significant at
the p<0.05 level and suggest a significant increase or decrease in
mRNA expression as compared to control group. C: Changes of CB1,
CB2, and FAAH protein expression in ARPE-19 cells assayed
by western blot method. D: Changes of CB1, CB2 protein
expression in ARPE-19 cells demonstrated by immunofluorescent staining.
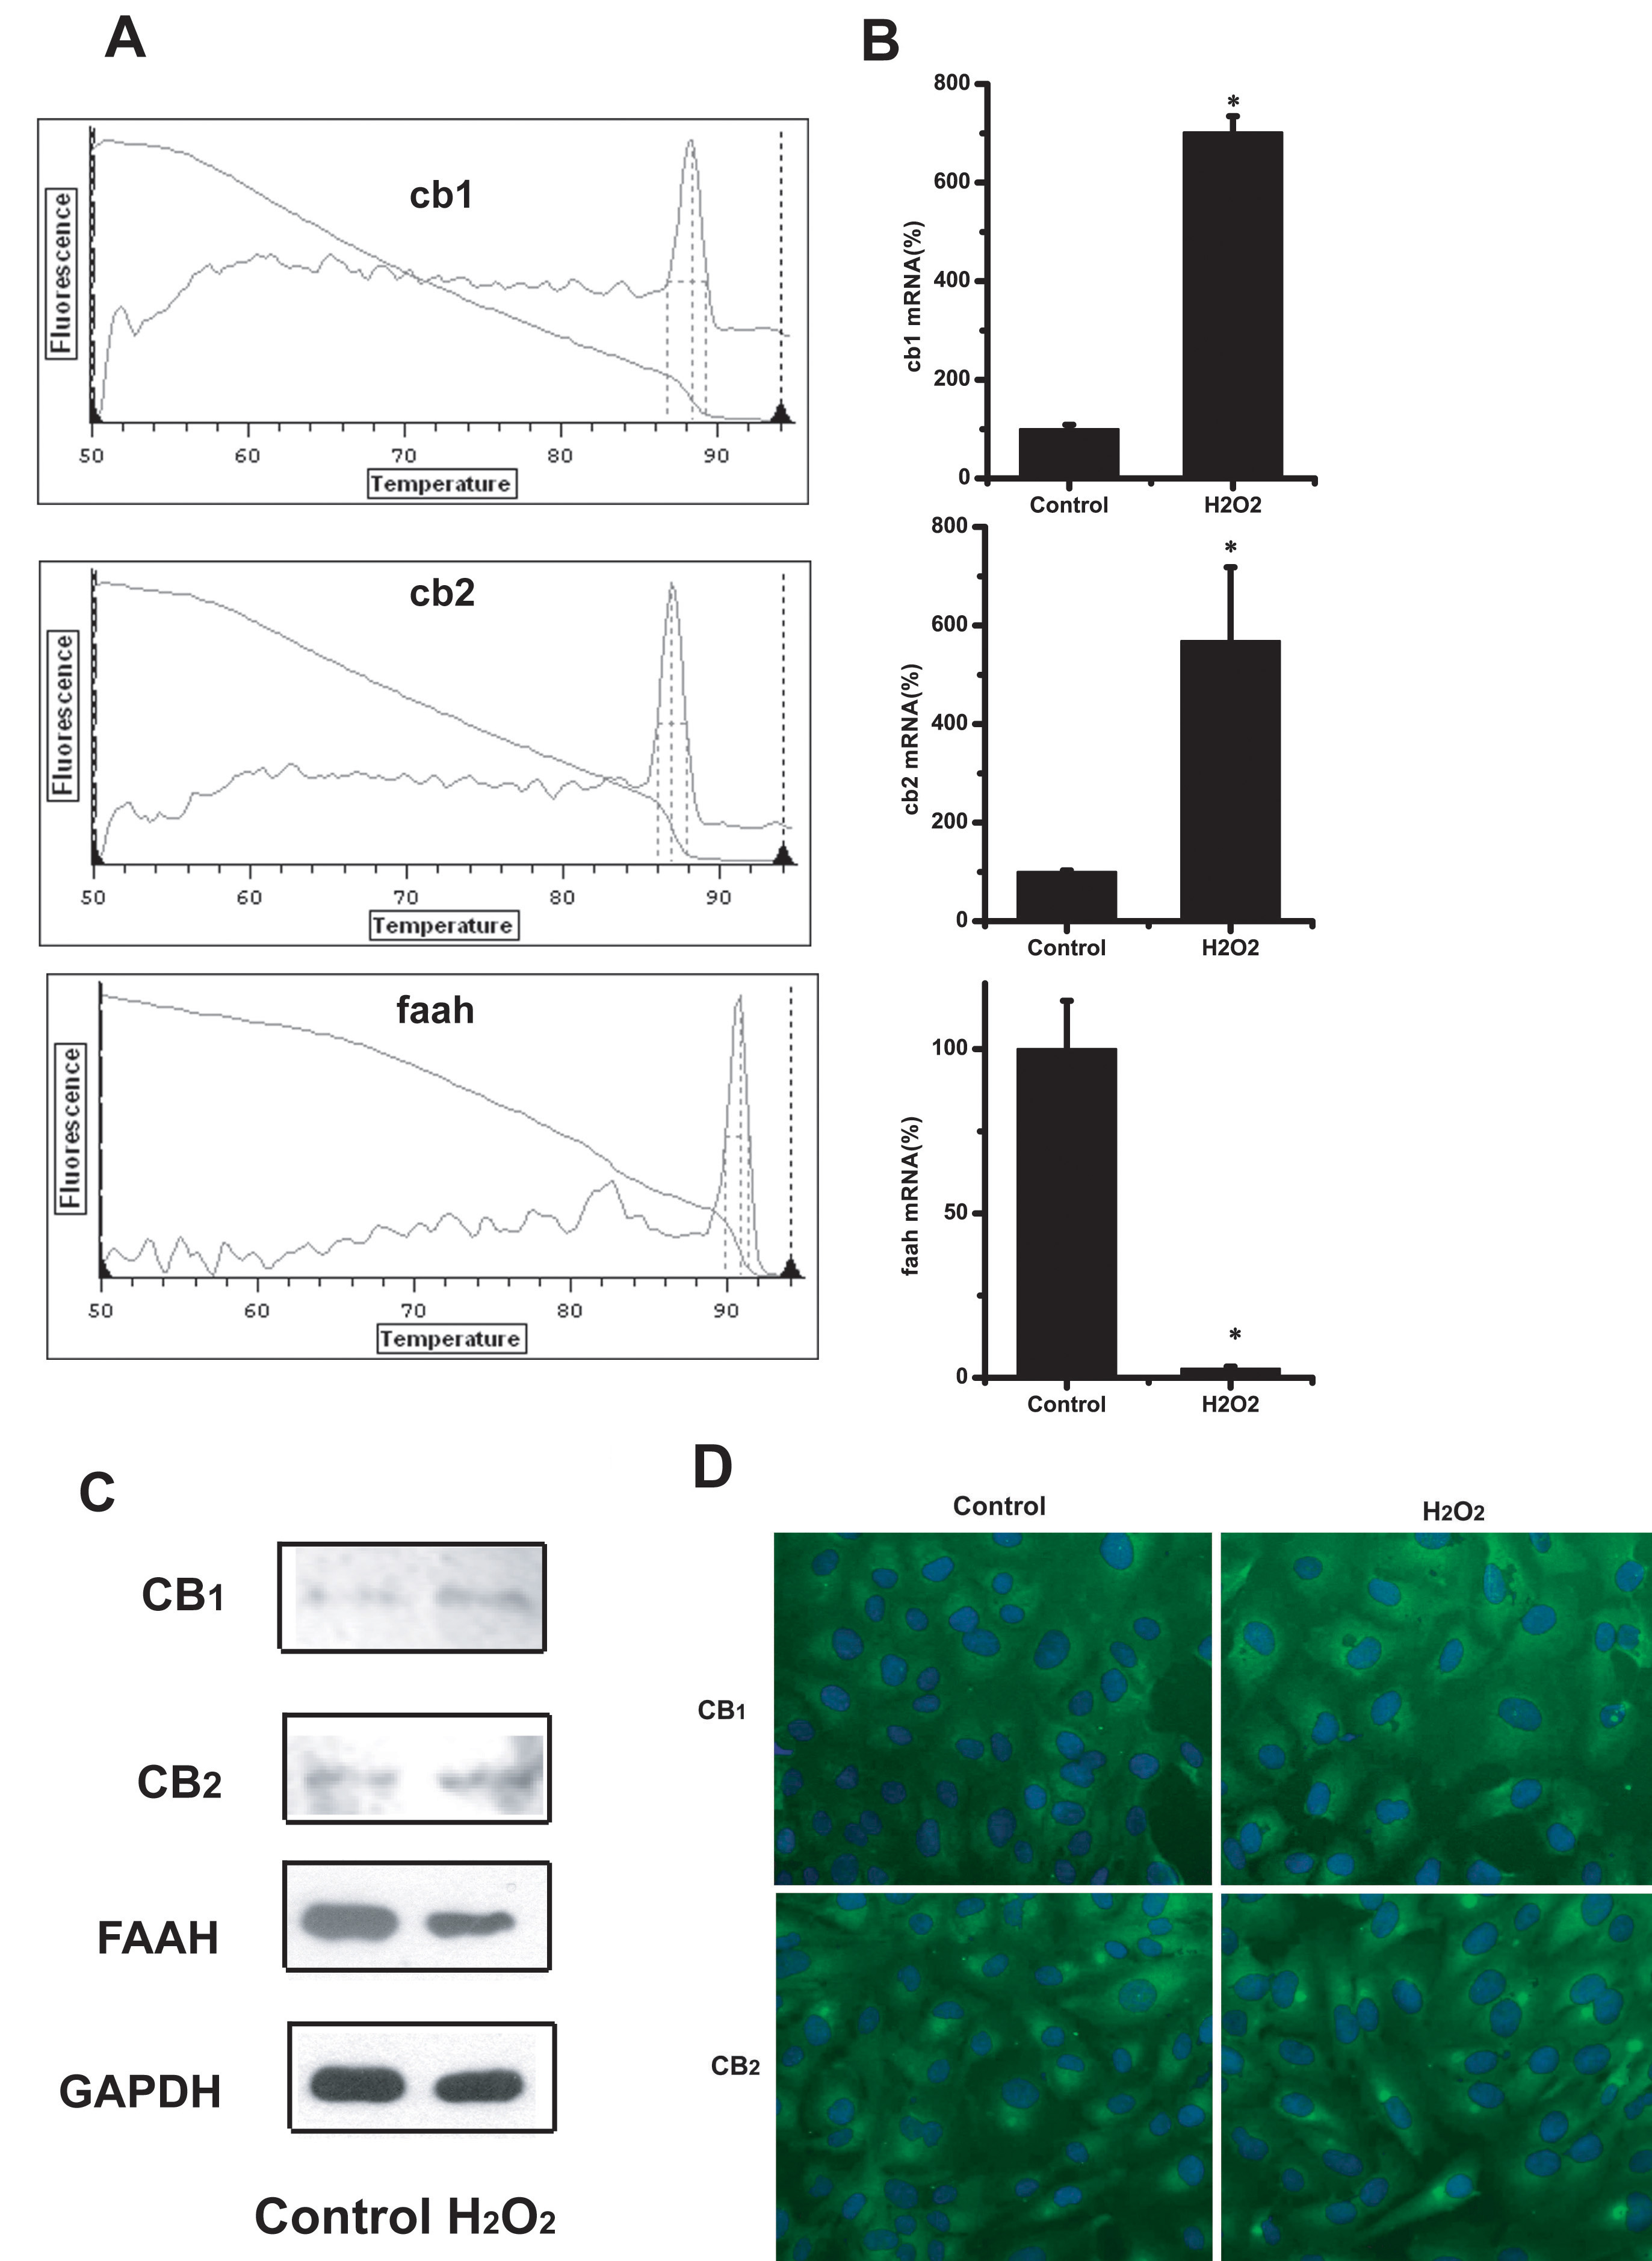
 Figure 2 of Wei, Mol Vis 2009; 15:1243-1251.