Figure 1. Annexin A2 expression levels increased in a mouse model of hypoxia-induced retinopathy and in vitro. Relative mRNA levels
of Annexin A2 were normalized by GAPDH mRNA levels A: Levels of annexin A2 and VEGF mRNA were measured by quantitative real-time PCR in mouse retinas immediately after hypoxia
treatment (P13) and 12 h after return to room air (P14). Double asterisks (**) indicate a p<0.01 compared with controls. Six
mice were used for each time point. B: The figures showed western blot results for annexin A2 protein in retinas from the mouse model of hypoxia-induced retinopathy
(days P12–P16). C: The figures showed the effects of cytokines factors on the expression of annexin A2 mRNA. RF/6A cells were treated respectively
with VEGF, IL1-β, TNF-α, FGF2, or PIGF at 25 ng/ml for 2 h. CN was Annexin A2 expression levels in RF/6A cells untreated with
the cytokines. Total RNA was isolated, and quantitative real-time PCR was used to detect the expression of annexin A2 mRNA.
Results are representative of three independent experiments, each performed with duplicate samples. Asterisk (*) indicates
a p<0.05 compared with untreated control.
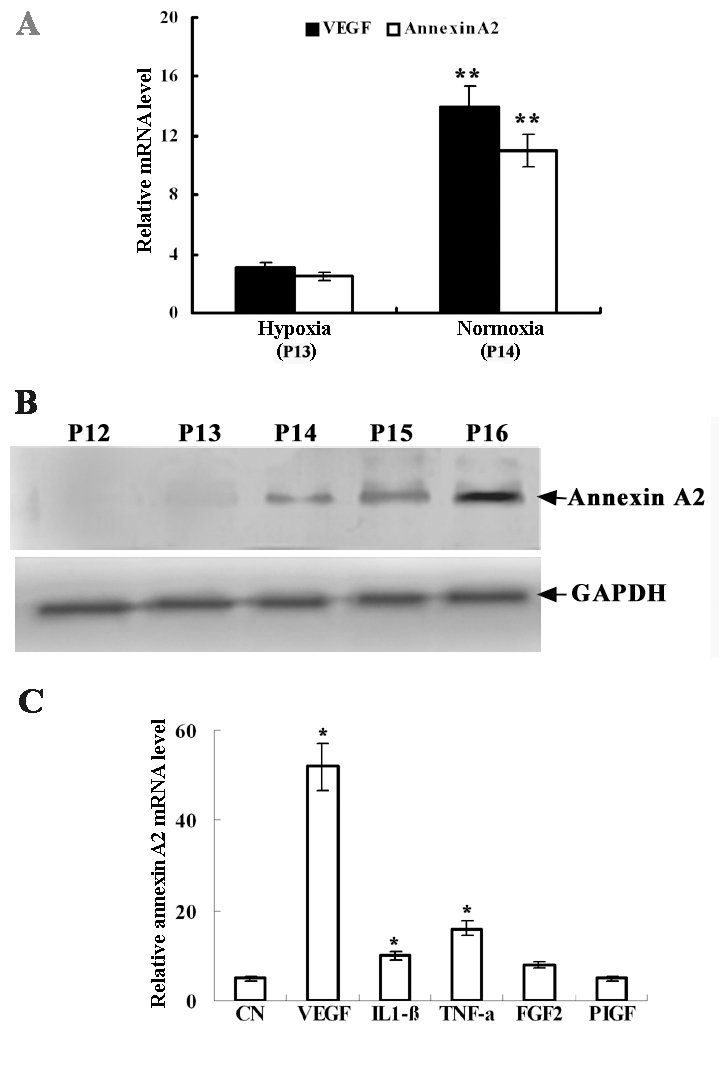
 Figure 1 of
Zhao, Mol Vis 2009; 15:1231-1242.
Figure 1 of
Zhao, Mol Vis 2009; 15:1231-1242.