Figure 7. Fundus autofluorescence images of three affected individuals. A (right eye) and B (left eye) of individual III:1. Showing bilateral discrete areas of central confluent hypofluorescence associated with the
areas of geographic atrophy noted clinically. The borders of this area are hyperfluorescent. C (right eye) D (left eye) of individual III:3. Bilateral areas of stippled hyperfluorescence and hypofluorescence extending toward the vascular
arcades corresponding to the areas of subretinal fluid noted clinically. E (right eye) F (left eye) of individual III:4. In the right eye, a large stippled area of hyperfluorescence and hypofluorescence extending
beyond the vascular arcades was noted. Of note, the areas of floccular yellow deposits seen on funduscopy were hypofluorescent
on fundus autofluorescence imaging. Fundal autofluorescence in the left eye (without visual loss) was unremarkable.
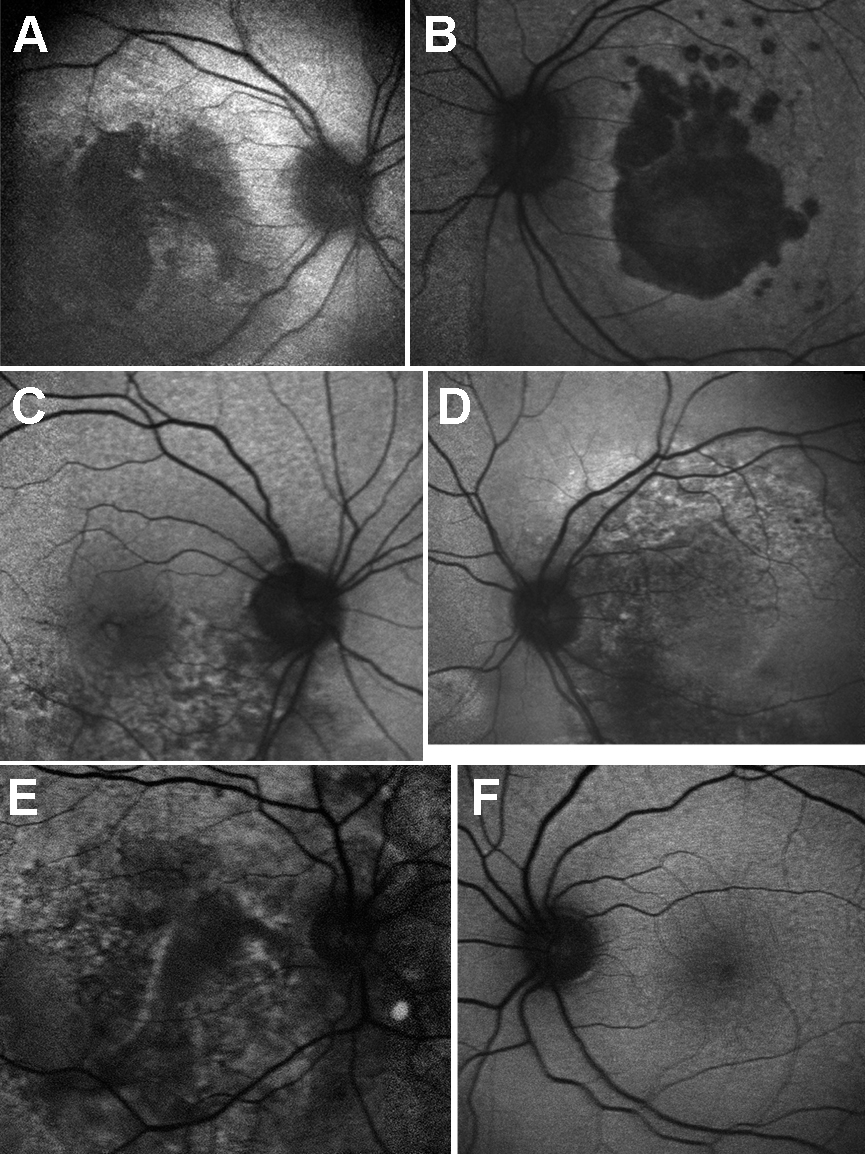
 Figure 7 of
Saihan, Mol Vis 2009; 15:1218-1230.
Figure 7 of
Saihan, Mol Vis 2009; 15:1218-1230.