Figure 5. LDL increases p38MAPK
phosphorylation. A: This panel shows representative western
immunoblots from one experiment, and densitometric data from three
experiments (mean±SD) describing the time course of LDL-induced p38
MAPK phosphorylation (P-p38MAPK and T-p38MAPK means phosphorylated and
total p38 MAPK). B: This panel shows representative western
immunoblots from one experiment, and densitometric data from three
experiments (mean±SD) describing dose effects of LDL on p38 MAPK
phosphorylation. N-LDL and HOG-LDL had similar effects on p38 MAPK
phosphorylation. Control immunosignal (T-p38MAPK) bands were detected
in the same gels as P-p38MAPK after stripping and re-probing. In both
panels, densitometric calculations of P-p38MAPK were corrected for
T-p38MAPK. Asterisk represents p<0.05 compared to control (Time 0 or
Dose 0).
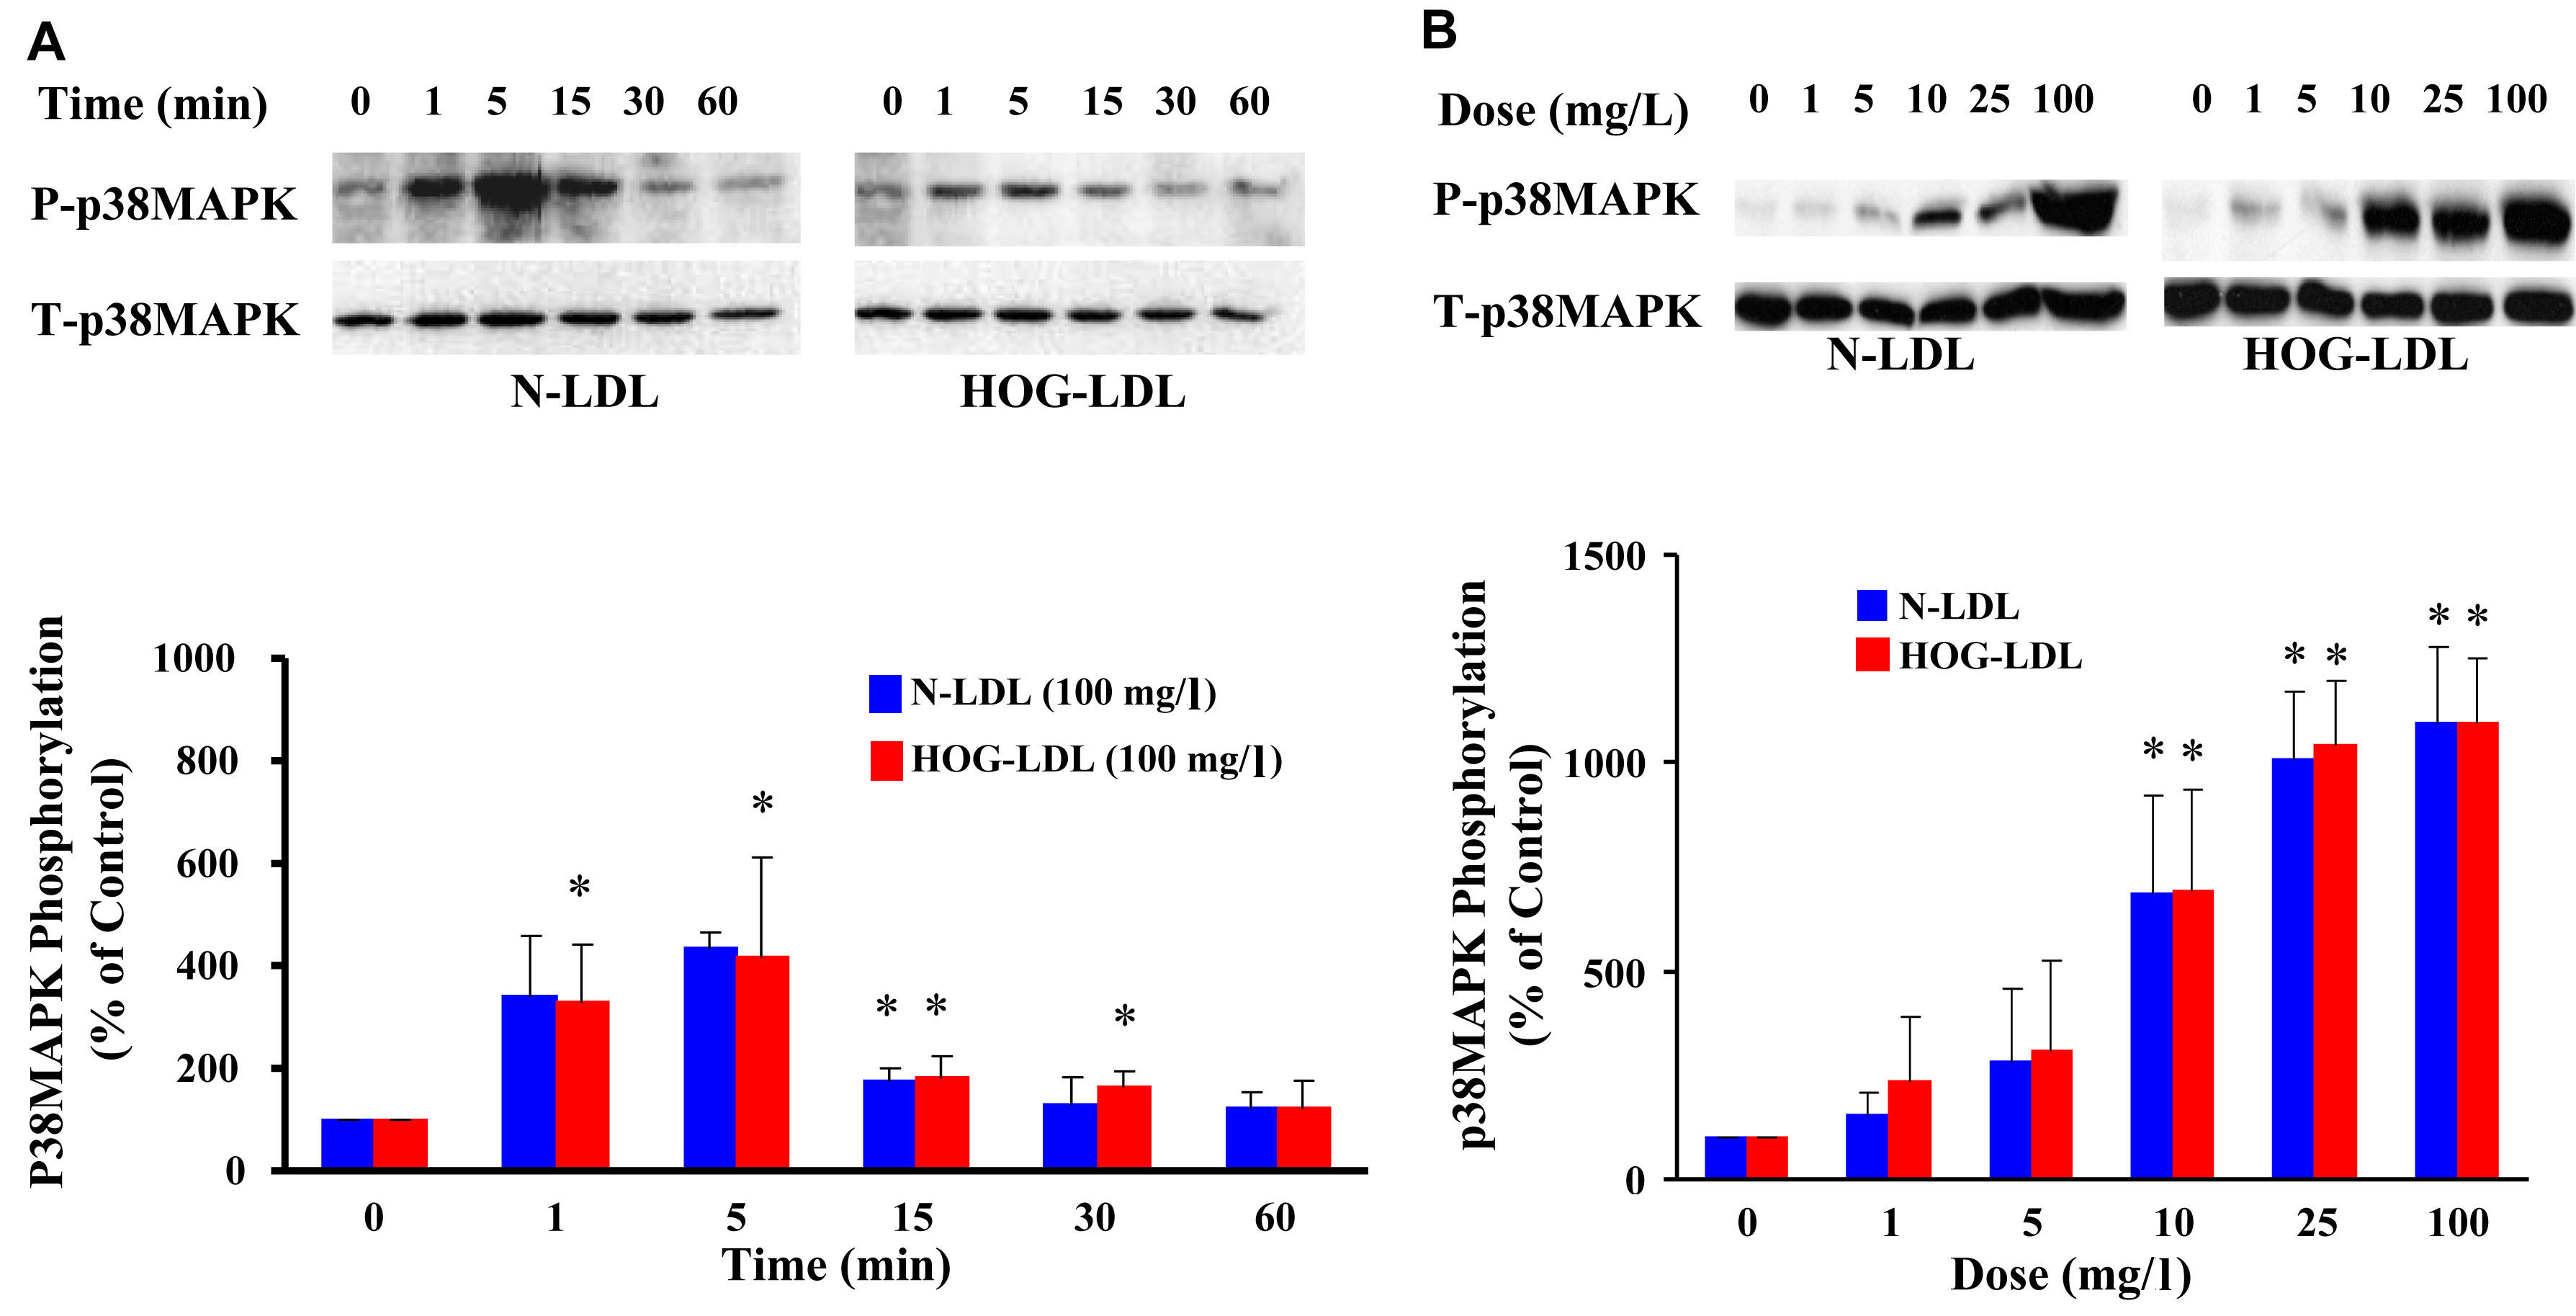
 Figure 5 of Diffley, Mol Vis 2009; 15:135-145.