Figure 5. Assessment of the contribution
of regions of the NMR spectra and specific metabolites to the
discrimination between lens-induced and chronic uveitis. A:
Loadings plots from the PLSDA analysis which indicates regions of the
spectra which provide the greatest degree of discrimination between the
two forms of uveitis. Positive peaks correspond to metabolites that are
at higher concentration in the chronic relative to the LIU, and vice
versa. B: Based on the original spectra and the loadings plot,
peak heights of prominent metabolites resonances were plotted for each
sample. Peak heights were compared using a T test.
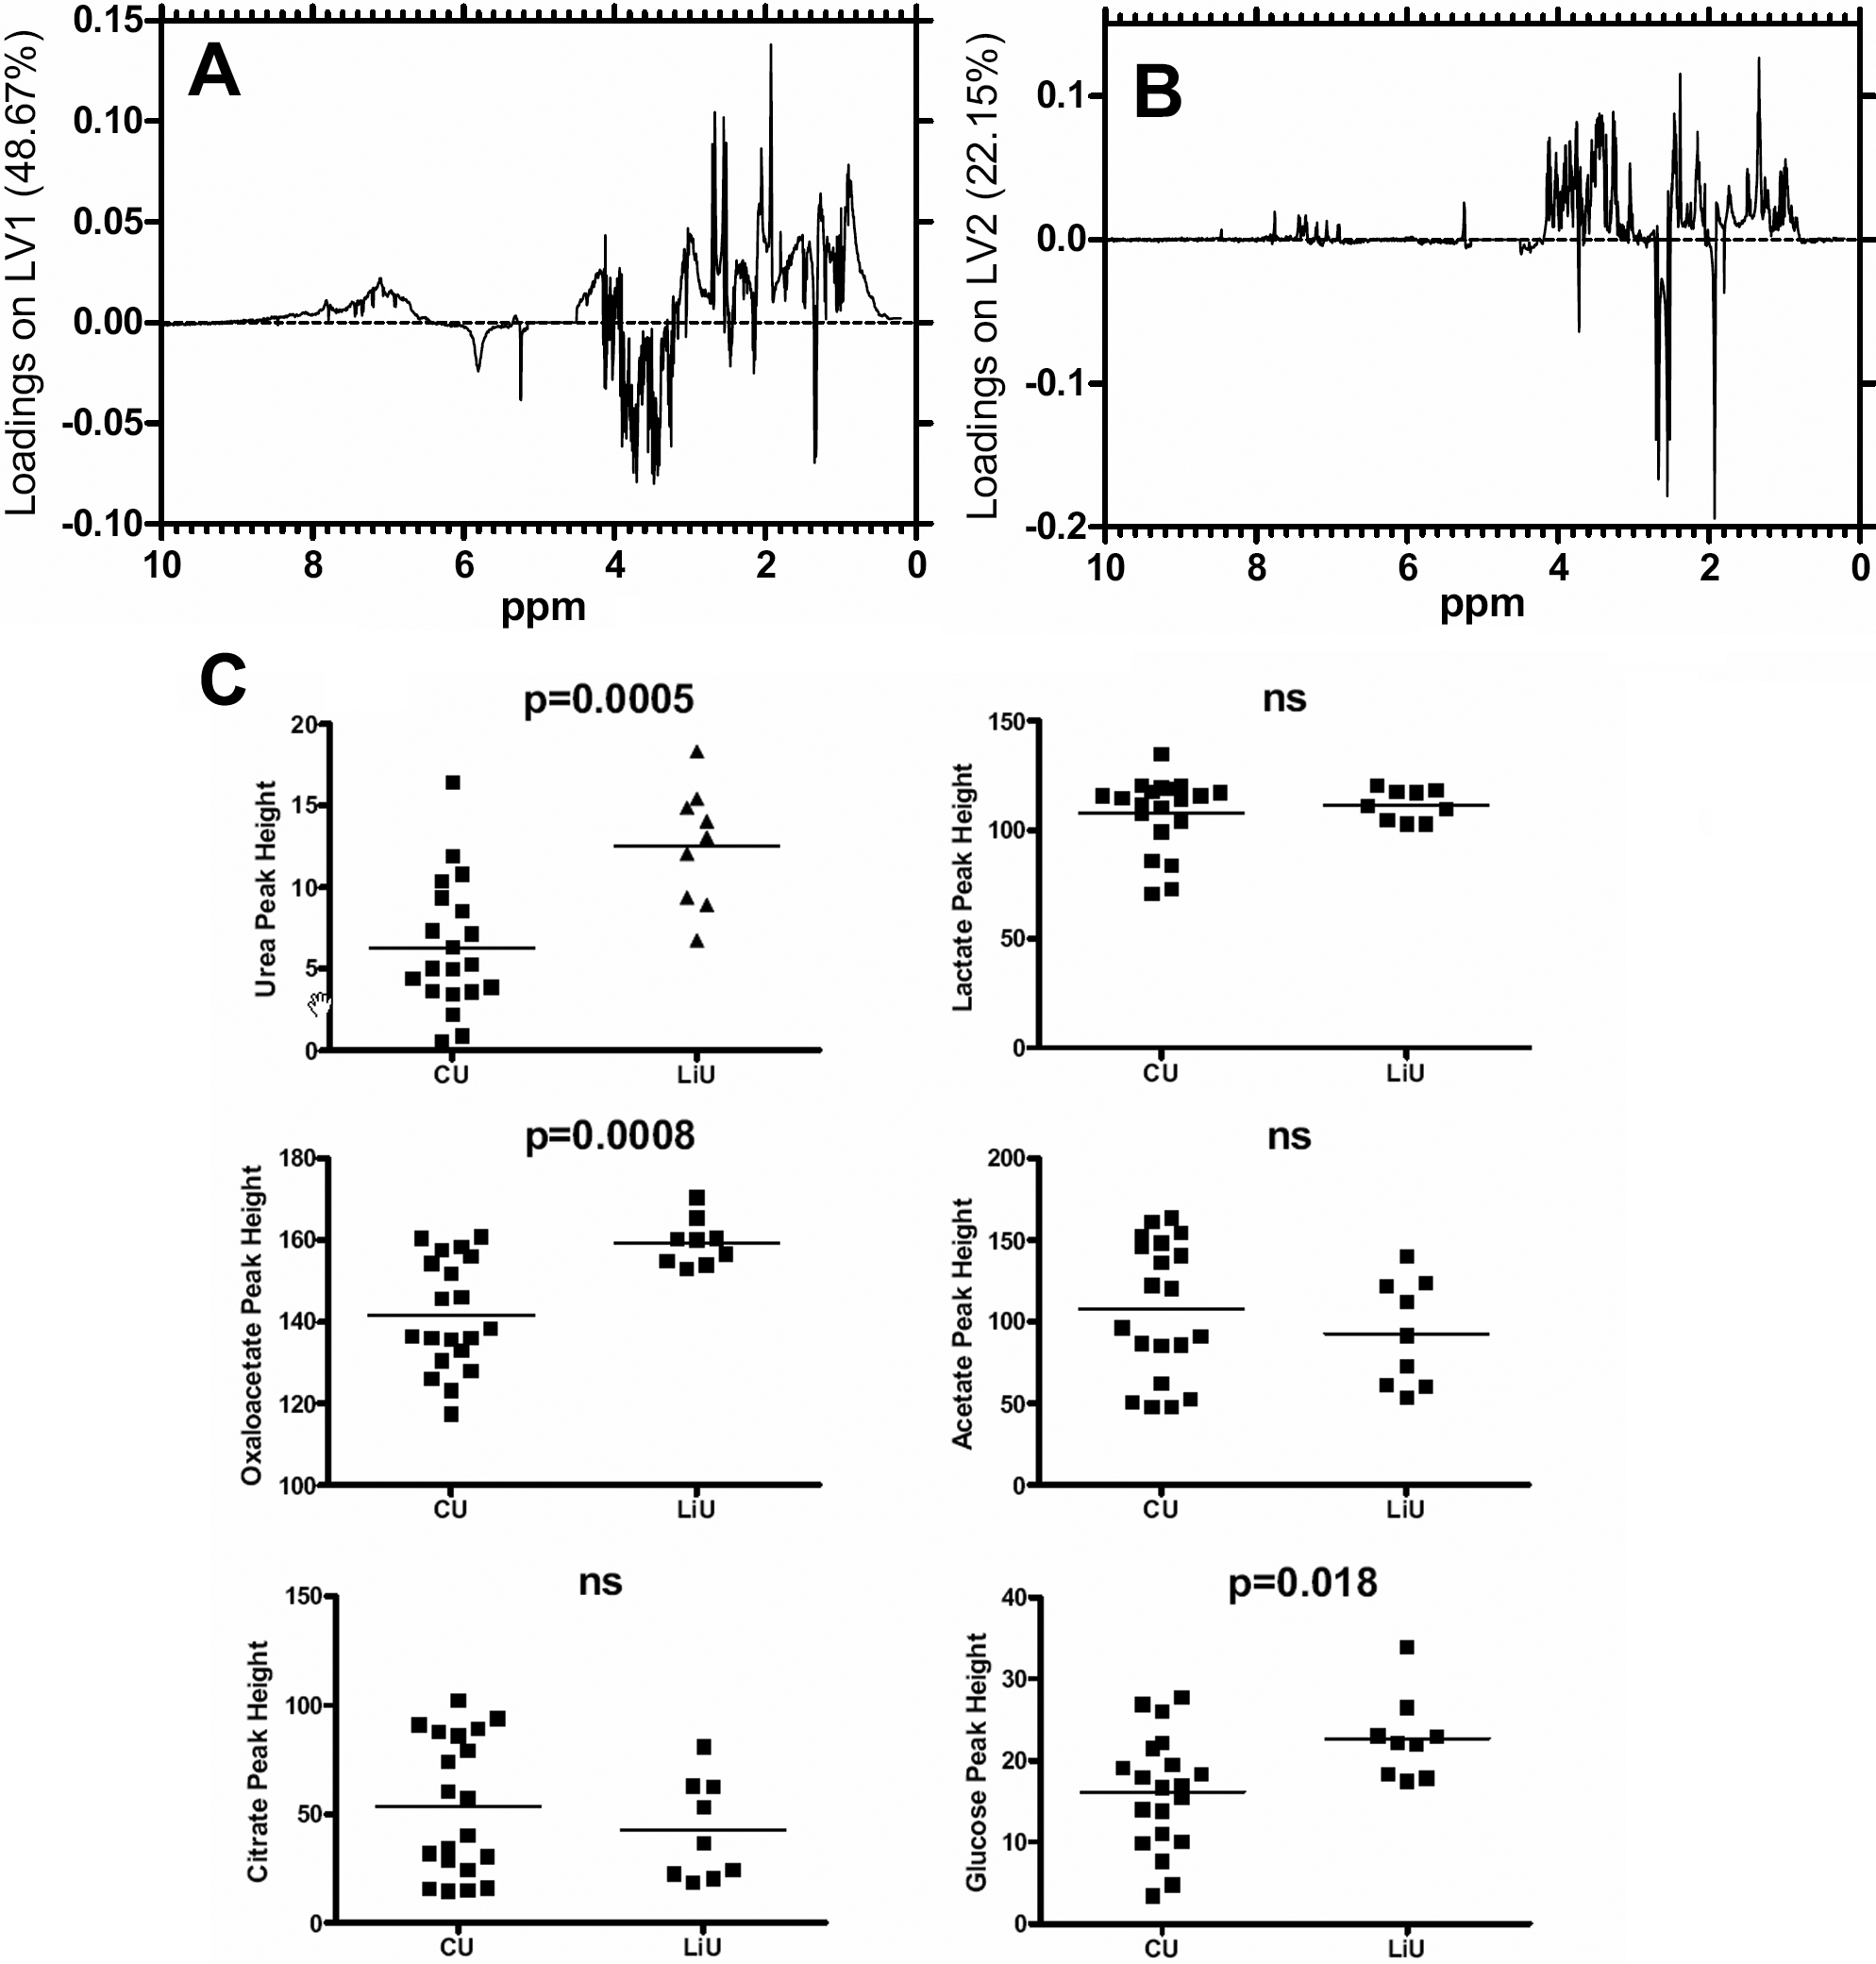
 Figure 5 of Young, Mol Vis 2009; 15:1210-1217.